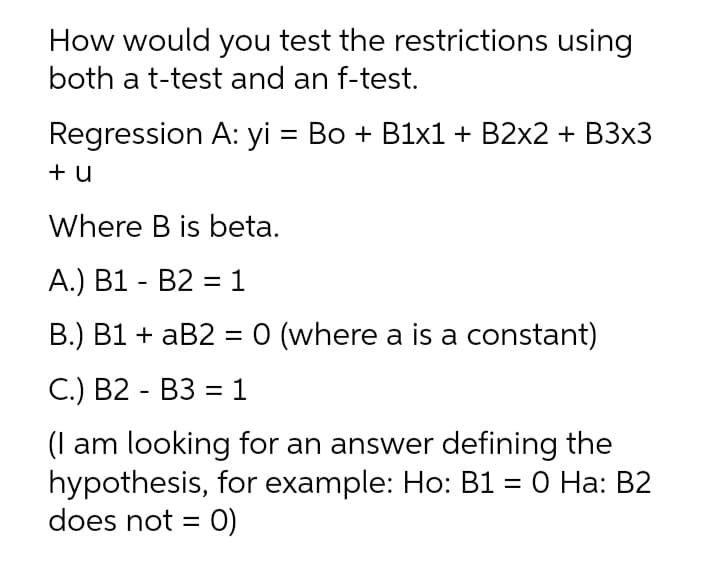
How would you test the restrictions using both a t-test and an f-test. Regression A: yi = Bo + B1x1 + B2x2 + B3x3 + u Where B is beta. A.) B1 - B2 = 1 B.) B1 + aB2 = 0 (where a is a constant) C.) B2 - B3 = 1 (I am looking for an answer defining the hypothesis, for example: Ho: B1 = 0 Ha: B2 does not = 0)


Q: In the regression model Y, = a, +aX;+a,D, +a¿(X,* D)+u, X is a continuous variable and D is dummy…
A: Answer : Option B correct F-statistics for the joint hypothesis that α2 = 0, α3 = 0
Q: Consider a model with an interaction term between being female and being married. The dependent…
A: Given information:- Coefficient of interaction term=0.301Standard error of interaction…
Q: you are testing ho: u=0 against ha=u not equal 0 based on an SRS of four observations from a normal…
A: we have given that H0: mu=0 vs Ha:mu not=0 and n=4 ,level of significance (alpha)=0.005
Q: Use a 1% level of significance to test the claim that ρ 0 c.) H0: ρ 0 d.) H0: ρ > 0 and H1: ρ <…
A: Since, we answer up to three sub-parts, we'll be answering the first three subparts. Please resubmit…
Q: A study conducted at Ateneo de Naga University revealed that students who attended class 95 to 100%…
A: Given: Number of students in research N=5000 Number of students participated in survey n=100
Q: Data from the Motor Vehicle Department indicate that 80% of all licensed drivers are older than age…
A: (A). Propose the suitable analysis: Denote the proportion of licensed drivers who are older than 25…
Q: b. Consider the simple regression model y; = Bo + B1xi + €i, i = 1,...,n with e; ~ independent.…
A: From the given information, The provided simple linear regression model as given below:…
Q: Assume that data are available on other characteristics of the subjects that are relevant to…
A: Since other relevant characteristics are not included.
Q: 3) Consider a simple linear regression model Y = Bo + B₁1x + e, where Y is the response variable, x…
A:
Q: What is the most appropriate interpretation of the assumption covlu,u)-0 concerning the regression…
A: Covariance provides insight into how two variables are related to one another. More precisely,…
Q: You are conducting a test of independence for the claim that there is an association between the row…
A: The given claim is that there is an association between row variable and the column variable.
Q: if you are doing a regression Yi=b1+b2.6 X2i+b3 X3i+ei on a sample of 9 observation and you get the…
A: Solution
Q: In a study, data collected for 40 observations were used to model the dependent variable y with 8…
A: Note: Hi there! Thank you for posting the question. As your question has more than 3 parts, we have…
Q: An analyst believes that the only important determinant of banks’ returns on assets (Y) is the ratio…
A: The coefficient of determination lies between 0 and 1. It gives us the strength of relation of X and…
Q: Consider the standard simple regression model y = Bo + Bix + u under standard assumptions The usual…
A: Hi! Thank you for the question, As per the honor code, we are allowed to answer three sub-parts at a…
Q: You have a multiple regression that contains one dependent variable Y and four independent variables…
A: Multiple regression: A multiple regression analysis is used when two or more independent variables…
Q: You are conducting a test of independence for the claim that there is an association between the row…
A: Here we want to check the independence of association of two rows and two columns. . For that…
Q: Derive the normal equation for finding the least-squares linear fit through the origin y = Ax.
A:
Q: Is a negative Pseudo R² in Tobit regression a problem?
A: Introduction: Tobit regression models form a class of regression models, in which, the range of the…
Q: (New Question) Consider the following regression equation with panel data: Yt = Bo + B1 Xt + y½ D2;…
A: As, the dummy variables either could be 1 or 0. Then, the coefficients of these dummy variable would…
Q: 23) The values of the regression coefficients are found such the sum of the residuals is…
A: We have to fill the blank of the given statement. The values of the regression coefficients are…
Q: You are conducting a test of independence for the claim that there is an association between the row…
A: We have to find expected observations for this table and chi-square test-statistic.
Q: For a hypothesis test of the claim that the mean amount of sleep for adults is less than 9 hours,…
A: Since the power is defined as the probability of making the correct decision if the alternative…
Q: 200 males and 200 females are asked a series of questions to determine whether they are considered…
A: Given information: 200 males and 200 females are asked whether they are heavy drinkers or not. 66…
Q: (i) Consider the multiple regression containing three independent variables: Y = Bo + B1 X1 + B2X2 +…
A: Consider Me multiple regression model containing three independent variables such that the model is…
Q: Sick leave of employees in a factory before and after Covid-19 was investigated in a year. Which of…
A: The Wilcoxon signed rank test is a non-parametric test. It is used to compare two related samples or…
Q: A car manufacturer advertises that its new subcompact models get an average of 47 miles per gallon.…
A: Solution
Q: 4. Explain the RESET test as a general test for functional form misspecification and discuss the…
A: Model Misspecification Functional form misspecification generally means that the model does not…
Q: You are conducting a test of independence for the claim that there is an association between the row…
A:
Q: Consider the one-variable regression model Yi = β0 + β1Xi + ui and suppose that it satisfies the…
A:
Q: You are conducting a test of independence for the claim that there is an association between the row…
A: Here we have given the observed value as follows; Now, we have to calculate the expected value…
Q: You are conducting a test of independence for the claim that there is an association between the row…
A: Given data X Y Z A 45 6 60 B 28 3 28
Q: You are conducting a test of independence for the claim that there is an association between the row…
A: From the provided information, X Y Z Total A 30 37 38 105 B 41 42…
Q: Myla conducted a survey to all grade 6 students and claimed that their average age is 12. 5. What is…
A: 5. The parameter of Interest is a) Average age is 12. because this is the parameter we are…
Q: You are conducting a test of independence for the claim that there is an association between the row…
A: The column and row total for the given data is,
Q: Consider the simple regression model y, = Bo + B1r, + e, i = 1,.., n with e,~ N(0, a). The es are…
A: Simple linear regression model: A simple linear regression model is given as y = b0 + bx, where y is…
Q: Consider the multiple regression model with three independent variables, under the classical linear…
A: Given: Consider the multiple linear regression models with three independent variables as given…
Q: 2. Let kids denote the number of children ever born to a woman, and let educ denotes years of…
A: Here, kids = B0 + B1educ + u
Q: After running a regression you conduct a hypothesis test of Ho: B = 2.5 versus H1: B * 2.5 is…
A: The hypothesis test on regression is conducted. The null hypo. is H0:β=2.5 The alternate hypo. is…
Q: The proportion of students who get an undergraduate degree in statistics in four years was compared…
A: The proportion of students who get an undergraduate degree in statistics in four years was compared…
Q: One hundred individuals, aged 20-58, were given a test of psychomotor skill. Both age and score were…
A: It is needed to test for dependency of the scores obtained in the psychometric test and the…
Q: Now complete the chi-square test to determine if the Hardy-Weinberg equilibrium has been violated,…
A: Null hypothesis: there is no significant difference between observed and expected frequencies. sum…
Q: When we add a statistically significant interaction term between the independent variables x1 and x2…
A: Models that include interaction effects may also be analyzed by multiple linear regression methods.…
Q: You are conducting a test of independence for the claim that there is an association between the row…
A:
Q: FOR THIS, WE REJECT THE NULL FOR BOTH MODELS.
A: Consider the level of significance as 0.05.
Q: Consider the following regression model: Y; = Bo + B1X1i + B2X2¡ + B3X3¡ + B4X4¡ + Ui We want to…
A: From the given information, The regression model is, And H0:β3+β4=0 vs H1:β3+β4≠0 The regression…
Q: IF the regression Yi=b1+b2X2i+b3X3i+b4X4i+ei represent model 1, and regression Yi=b1+b3X3i+ ei…
A: Here, the number of independent variables in both models and the values of Error Sum of Squares is…
Q: Use information in column (2) of table 1 to conduct a formal test of heteroskedasticity. The…
A: h0: no heteroskedasticity h1: there is heteroskedasticity
Q: Consider the following regression model: Y; = Bo + B1X11 + B2X2¡ + B3X3¡ + B4X4i + U¿ We want to…
A: From the given information, The regression model is, Yi=β0+β1X1i+β2X2i+β3X3i+β4X4i+ui And H0:β2=β3…
Q: 2) A researcher is comparing the number of hours of per day high school students spend using their…
A: a) Let 'μ1' represent the mean number of hours seniors spend time per day on their phones. And, 'μ2'…

Step by step
Solved in 2 steps with 2 images

- The least-squares regression equation is y=620.6x+16,624 where y is the median income and x is the percentage of 25 years and older with at least a bachelor's degree in the region. The scatter diagram indicates a linear relation between the two variables with a correlation coefficient of 0.7004. In a particular region, 28.3 percent of adults 25 years and older have at least a bachelor's degree. The median income in this region is $37,389. Is this income higher than what you would expect? Why?6. Consider the regression model Yi = βXi + ui, where ui and Xi satisfy the least squares assumptions in Key Concept 4.3. Let β ̄ denote an estimator of β that is constructed as β ̄ = Y ̄/X ̄, where Y ̄ and X ̄ are the sample means of Yi and Xi, respectively. (a) Show that β ̄ is a linear function of Y1 , ..., Yn . (b) Show that β ̄ is conditionally unbiased.In a Right Tailed Hypothesis test, the test statistic was found to be Z=2.74The rejection region included values greater than the critical value Zc=2.02 The conclusion would be to... Reject the null hypothesis because the test statistic is NOT in the rejection region Fail to reject the null hypothesis because the test statistic is in the rejection region Fail to reject the null hypothesis because the test statistic is NOT in the rejection region Reject the null hypothesis because the test statistic is in the rejection region Accept the null hypothesis because the test statistic is NOT in the rejection region
- The least-squares regression equation is y=784.6x+12,431 where y is the median income and x is the percentage of 25 years and older with at least a bachelor's degree in the region. The scatter diagram indicates a linear relation between the two variables with a correlation coefficient of 0.7962. In a particular region, 26.5 percent of adults 25 years and older have at least a bachelor's degree. The median income in this region is $29,889. Is this income higher or lower than what you would expect? Why?The least-squares regression equation is y=728.0x+14,705 where y is the median income and x is the percentage of 25 years and older with at least a bachelor's degree in the region. The scatter diagram indicates a linear relation between the two variables with a correlation coefficient of 0.8165. For every dollar increase in median income, the percent of adults having at least a bachelor's degree is ___%, on average. For a median income of $0, the percent of adults with a bachelor's degree is ____%.18 - Regresyon modelini bulunuz. Find the regression model.X Y 10 23 13 27 14 30 A) y=-3,16+0,58xB) y= 6,27+1,65xC) y=2,42+8,43xD) y=1,65+6,27xE) y=9,23+5,55x
- Find the least-squares regression line y^=b0+b1x through the points (−1,1),(1,8),(5,14),(8,20),(11,27) and then use it to find point estimates ?̂y^ corresponding to x=1 and x=6. For x=1, y^ = For x=6, y^ =The least-squares regression equation is y=620.6x+16,624 where y is the median income and x is the percentage of 25 years and older with at least a bachelor's degree in the region. The scatter diagram indicates a linear relation between the two variables with a correlation coefficient of 0.7004. Predict the median income of a region in which 30% of adults 25 years and older have at least a bachelor's degree.
