Consider the following regression model: Y; = Bo + B1X1i + B2X2¡ + B3X3¡ + B4X4¡ + Ui We want to test the following null hypothesis: Họ: ß3+ß4 = 0 vs. H1: B3+ß4 # 0 The initial regression, so that the null hypothesis can be tested using the t-statistic m (testing a restriction on a single regression coefficient), can be rewritten using the fo form:
Consider the following regression model: Y; = Bo + B1X1i + B2X2¡ + B3X3¡ + B4X4¡ + Ui We want to test the following null hypothesis: Họ: ß3+ß4 = 0 vs. H1: B3+ß4 # 0 The initial regression, so that the null hypothesis can be tested using the t-statistic m (testing a restriction on a single regression coefficient), can be rewritten using the fo form:

MATLAB: An Introduction with Applications
6th Edition
ISBN:9781119256830
Author:Amos Gilat
Publisher:Amos Gilat
Chapter1: Starting With Matlab
Section: Chapter Questions
Problem 1P

Related questions
Question
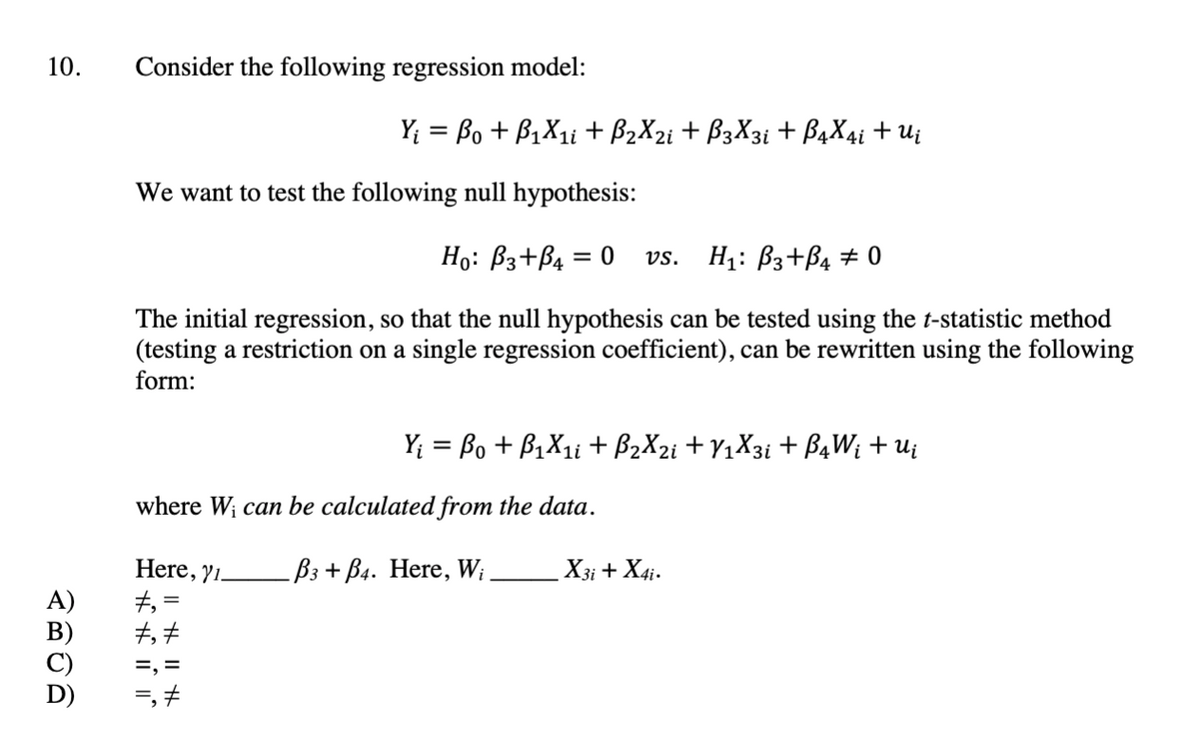
Transcribed Image Text:10.
Consider the following regression model:
Y; = Bo + B1X1i + B2X2i + B3X3¡ + B4X4¡ + Ui
We want to test the following null hypothesis:
Họ: ß3+B4 = 0
vs. H1: B3+B4 # 0
%3D
The initial regression, so that the null hypothesis can be tested using the t-statistic method
(testing a restriction on a single regression coefficient), can be rewritten using the following
form:
Y; = Bo + B1X11 + B2X2¡ + Y1X3¡ + B4W; + u;
where W; can be calculated from the data.
Here, yı.
-Вз + Ba. Here, W,
X3i + X4i.
A)
+, =
=, =
=, +
Expert Solution
Step 1
From the given information,
The regression model is,
And
vs
The regression equation is rewritten as
........(1)

Trending now
This is a popular solution!

Step by step
Solved in 2 steps with 1 images

Recommended textbooks for you
MATLAB: An Introduction with Applications
Statistics
ISBN:
9781119256830
Author:
Amos Gilat
Publisher:
John Wiley & Sons Inc

Probability and Statistics for Engineering and th…
Statistics
ISBN:
9781305251809
Author:
Jay L. Devore
Publisher:
Cengage Learning

Statistics for The Behavioral Sciences (MindTap C…
Statistics
ISBN:
9781305504912
Author:
Frederick J Gravetter, Larry B. Wallnau
Publisher:
Cengage Learning
MATLAB: An Introduction with Applications
Statistics
ISBN:
9781119256830
Author:
Amos Gilat
Publisher:
John Wiley & Sons Inc
Probability and Statistics for Engineering and th…
Statistics
ISBN:
9781305251809
Author:
Jay L. Devore
Publisher:
Cengage Learning
Statistics for The Behavioral Sciences (MindTap C…
Statistics
ISBN:
9781305504912
Author:
Frederick J Gravetter, Larry B. Wallnau
Publisher:
Cengage Learning

Elementary Statistics: Picturing the World (7th E…
Statistics
ISBN:
9780134683416
Author:
Ron Larson, Betsy Farber
Publisher:
PEARSON

The Basic Practice of Statistics
Statistics
ISBN:
9781319042578
Author:
David S. Moore, William I. Notz, Michael A. Fligner
Publisher:
W. H. Freeman

Introduction to the Practice of Statistics
Statistics
ISBN:
9781319013387
Author:
David S. Moore, George P. McCabe, Bruce A. Craig
Publisher:
W. H. Freeman