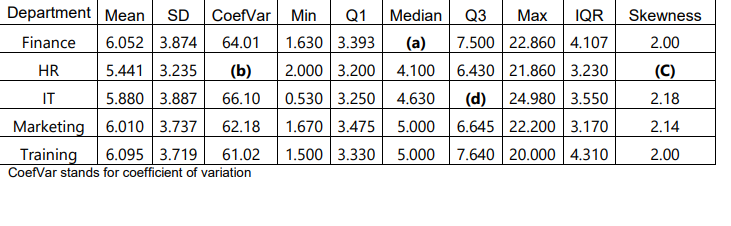
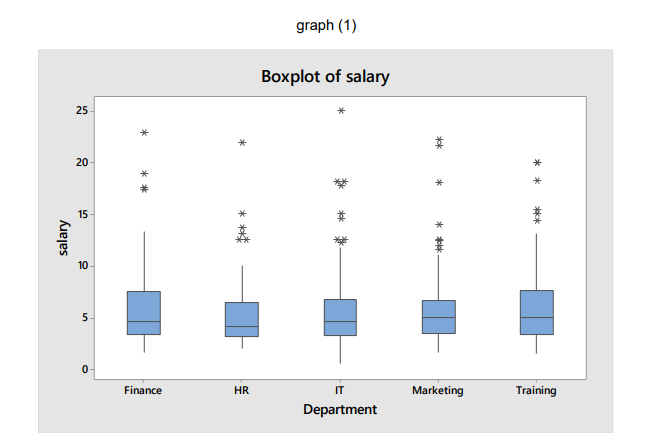
HR manager in L&B real-state company is working with finance department in improving the salaries and the following descriptive statistics were obtained ( The table attached ) ( The graph attached ) ------------ The company has hired you to answer the following questions: 1) Find the missing values of (a), (b), (c) and (d). 2) Do you think that the salaries in the departments are skewed, justify your answer with proper measure from table (2). 3) Based on the boxplot for the salaries by department in graph (1), comment on the graph in terms of existence of outliers, skewness and which department has higher outliers.


HR manager in L&B real-state company is working with finance department in improving the
salaries and the following
( The table attached )
( The graph attached )
------------
The company has hired you to answer the following questions:
1) Find the missing values of (a), (b), (c) and (d).
2) Do you think that the salaries in the departments are skewed, justify your answer with proper measure
from table (2).
3) Based on the boxplot for the salaries by department in graph (1), comment on the graph in terms of
existence of outliers, skewness and which department has higher outliers.
4) Based on your answer in (3), comment and compare on the suitable central and absolute dispersion
measures depending on table (2).
5) Based on table (1), do you think the salaries of which group is more homogenous, support your answer
and comment on the results.

Step by step
Solved in 2 steps with 2 images
