https://gastate.view.usg.edu/d21/le/content/2755195/viewContent/53296382/View The nature exposure time period(s) that had the best self-reported health were fill in blank minute while the fill in blank had the worst reported health. (Fill in the blanks with time intervals). SUBMIT AND fill in blank minute Steps 1 and 2: Read the title and axis labels. Self Reported Health Percent of respondents 90 80 60 30 20 10 0 68:5 31.5. 0 72.7 27.3. 77.3 22.7 82 79:6 20:4 82 79.9 Not Good Good 0-59 60-119 120-179 180-239 240-299. Minutes in nature per week 20.1 >300 Figure 2. The percentage of respondents in each nature exposure time category who reported not good/good health.
https://gastate.view.usg.edu/d21/le/content/2755195/viewContent/53296382/View The nature exposure time period(s) that had the best self-reported health were fill in blank minute while the fill in blank had the worst reported health. (Fill in the blanks with time intervals). SUBMIT AND fill in blank minute Steps 1 and 2: Read the title and axis labels. Self Reported Health Percent of respondents 90 80 60 30 20 10 0 68:5 31.5. 0 72.7 27.3. 77.3 22.7 82 79:6 20:4 82 79.9 Not Good Good 0-59 60-119 120-179 180-239 240-299. Minutes in nature per week 20.1 >300 Figure 2. The percentage of respondents in each nature exposure time category who reported not good/good health.

Case Studies In Health Information Management
3rd Edition
ISBN:9781337676908
Author:SCHNERING
Publisher:SCHNERING
Chapter7: Healthcare Statistics And Research Methods
Section: Chapter Questions
Problem 7.13.1C

Related questions

Question
100%
Please asap
Transcribed Image Text:https://gastate.view.usg.edu/d21/le/content/2755195/viewContent/53296382/View
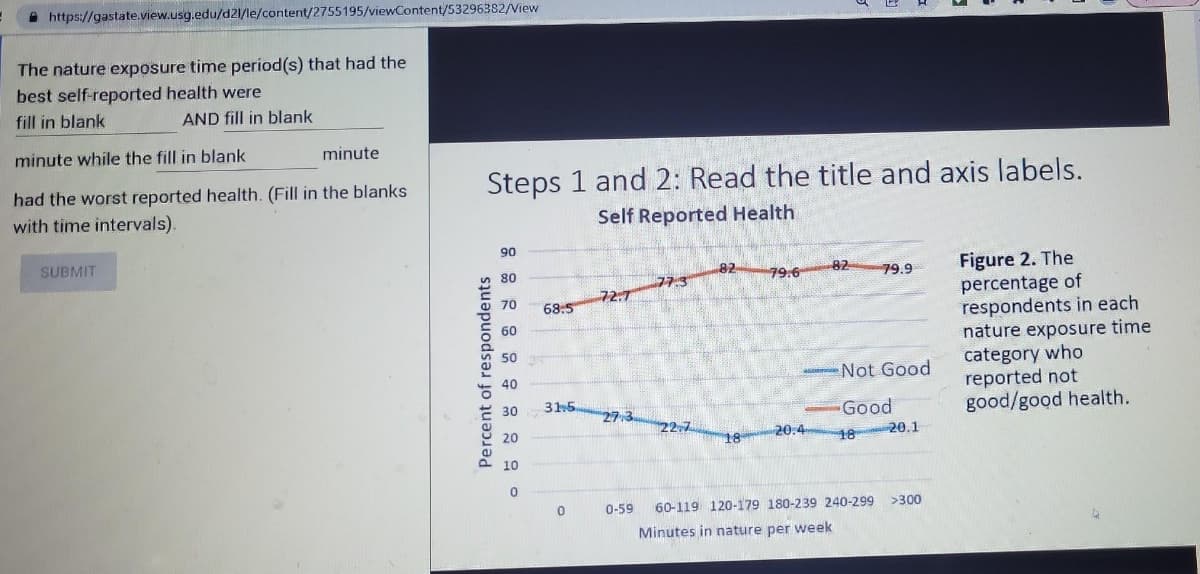
The nature exposure time period(s) that had the
best self-reported health were
fill in blank
minute while the fill in blank
had the worst reported health. (Fill in the blanks
with time intervals).
SUBMIT
AND fill in blank
minute
Steps 1 and 2: Read the title and axis labels.
Self Reported Health
Percent of respondents
90
80
60
30
20
10
0
68:5
31.5.
0
72.7
27.3
77.3
227
82 79:6
20:4
82
Not Good
Good
18
79.9
0-59 60-119 120-179 180-239 240-299
Minutes in nature per week
20.1
>300
Figure 2. The
percentage of
respondents in each
nature exposure time
category who
reported not
good/good health.
Expert Solution
This question has been solved!
Explore an expertly crafted, step-by-step solution for a thorough understanding of key concepts.

This is a popular solution!

Trending now
This is a popular solution!

Step by step
Solved in 2 steps

Knowledge Booster


Learn more about
Need a deep-dive on the concept behind this application? Look no further. Learn more about this topic, biology and related others by exploring similar questions and additional content below.Recommended textbooks for you
Case Studies In Health Information Management
Biology
ISBN:
9781337676908
Author:
SCHNERING
Publisher:
Cengage

Nutrition Through The Life Cycle
Health & Nutrition
ISBN:
9781337919333
Author:
Brown, Judith E.
Publisher:
Cengage Learning,
Health Safety And Nutrition F/Young Child
Health & Nutrition
ISBN:
9781305144767
Author:
MAROTZ
Publisher:
Cengage
Case Studies In Health Information Management
Biology
ISBN:
9781337676908
Author:
SCHNERING
Publisher:
Cengage
Nutrition Through The Life Cycle
Health & Nutrition
ISBN:
9781337919333
Author:
Brown, Judith E.
Publisher:
Cengage Learning,
Health Safety And Nutrition F/Young Child
Health & Nutrition
ISBN:
9781305144767
Author:
MAROTZ
Publisher:
Cengage