Hypothesis Creation Develop a hypothesis that is of interest to you! Examine relationships between one or two phenological stages (called phenophases) for a single species (or phenophases for mutualist / parasite /herbivore pairs) and abiotic variables, such as temperature. You could also correlate field observations directly with NEON's biotic data. For example, you could: test the hypothesis that increasing temperatures (NEON dataset) are correlated with delayed fall leaf color change (NPN dataset) in a deciduous tree species (e.g., red maple, sycamore) ● test the hypothesis that increasing atmospheric CO2 (NEON dataset) is related to accelerated flowering (NPN dataset) in a spring wildflower species. Fall color change of deciduous trees in the southern Appalachians; evergreens are also shown. photo courtesy of Howard Neufeld. NEON datasets that will be most useful in these analyses are listed below. air temperature (NEON.DP1.00003.001); for instance, warmer biological temperatures could trigger earlier phenological events. note that these data can be sorted by spatial and temporal variables atmospheric CO2 (NEON.DP4.00067.001); for instance, increases in CO2 levels over time could shift the timing or intensity of botanical phenomena like flowering and fruiting elevation (NEON.DP3.30024.001); for example, organisms at higher elevations might have delayed phenologies leaf area index (NEON.DP3.30012.001); leaf area index (LAI), a biotic type of data, could correlate with bud burst, such that LAI increases after bud opening photosynthetically active radiation (NEON.RP1 00066.001) herhiu
Hypothesis Creation Develop a hypothesis that is of interest to you! Examine relationships between one or two phenological stages (called phenophases) for a single species (or phenophases for mutualist / parasite /herbivore pairs) and abiotic variables, such as temperature. You could also correlate field observations directly with NEON's biotic data. For example, you could: test the hypothesis that increasing temperatures (NEON dataset) are correlated with delayed fall leaf color change (NPN dataset) in a deciduous tree species (e.g., red maple, sycamore) ● test the hypothesis that increasing atmospheric CO2 (NEON dataset) is related to accelerated flowering (NPN dataset) in a spring wildflower species. Fall color change of deciduous trees in the southern Appalachians; evergreens are also shown. photo courtesy of Howard Neufeld. NEON datasets that will be most useful in these analyses are listed below. air temperature (NEON.DP1.00003.001); for instance, warmer biological temperatures could trigger earlier phenological events. note that these data can be sorted by spatial and temporal variables atmospheric CO2 (NEON.DP4.00067.001); for instance, increases in CO2 levels over time could shift the timing or intensity of botanical phenomena like flowering and fruiting elevation (NEON.DP3.30024.001); for example, organisms at higher elevations might have delayed phenologies leaf area index (NEON.DP3.30012.001); leaf area index (LAI), a biotic type of data, could correlate with bud burst, such that LAI increases after bud opening photosynthetically active radiation (NEON.RP1 00066.001) herhiu
Biology (MindTap Course List)
11th Edition
ISBN:9781337392938
Author:Eldra Solomon, Charles Martin, Diana W. Martin, Linda R. Berg
Publisher:Eldra Solomon, Charles Martin, Diana W. Martin, Linda R. Berg
Chapter54: Community Ecology
Section: Chapter Questions
Problem 17TYU: INTERPRET DATA Examine the top and middle graphs in Figure 54-5. Are these examples of exponential...
Related questions
Question
Can you help me giving an example and a hypothesis about this question

Transcribed Image Text:●
●
Hypothesis Creation
Develop a hypothesis that is of interest to you! Examine relationships between one or two
phenological stages (called phenophases) for a single species (or phenophases for mutualist / parasite
/herbivore pairs) and abiotic variables, such as temperature. You could also correlate field
observations directly with NEON's biotic
data. For example, you could:
• test the hypothesis that increasing
temperatures (NEON dataset) are
correlated with delayed fall leaf color
change (NPN dataset) in a deciduous
tree species (e.g., red maple, sycamore)
test the hypothesis that increasing
atmospheric CO2 (NEON dataset) is
related to accelerated flowering (NPN
dataset) in a spring wildflower species.
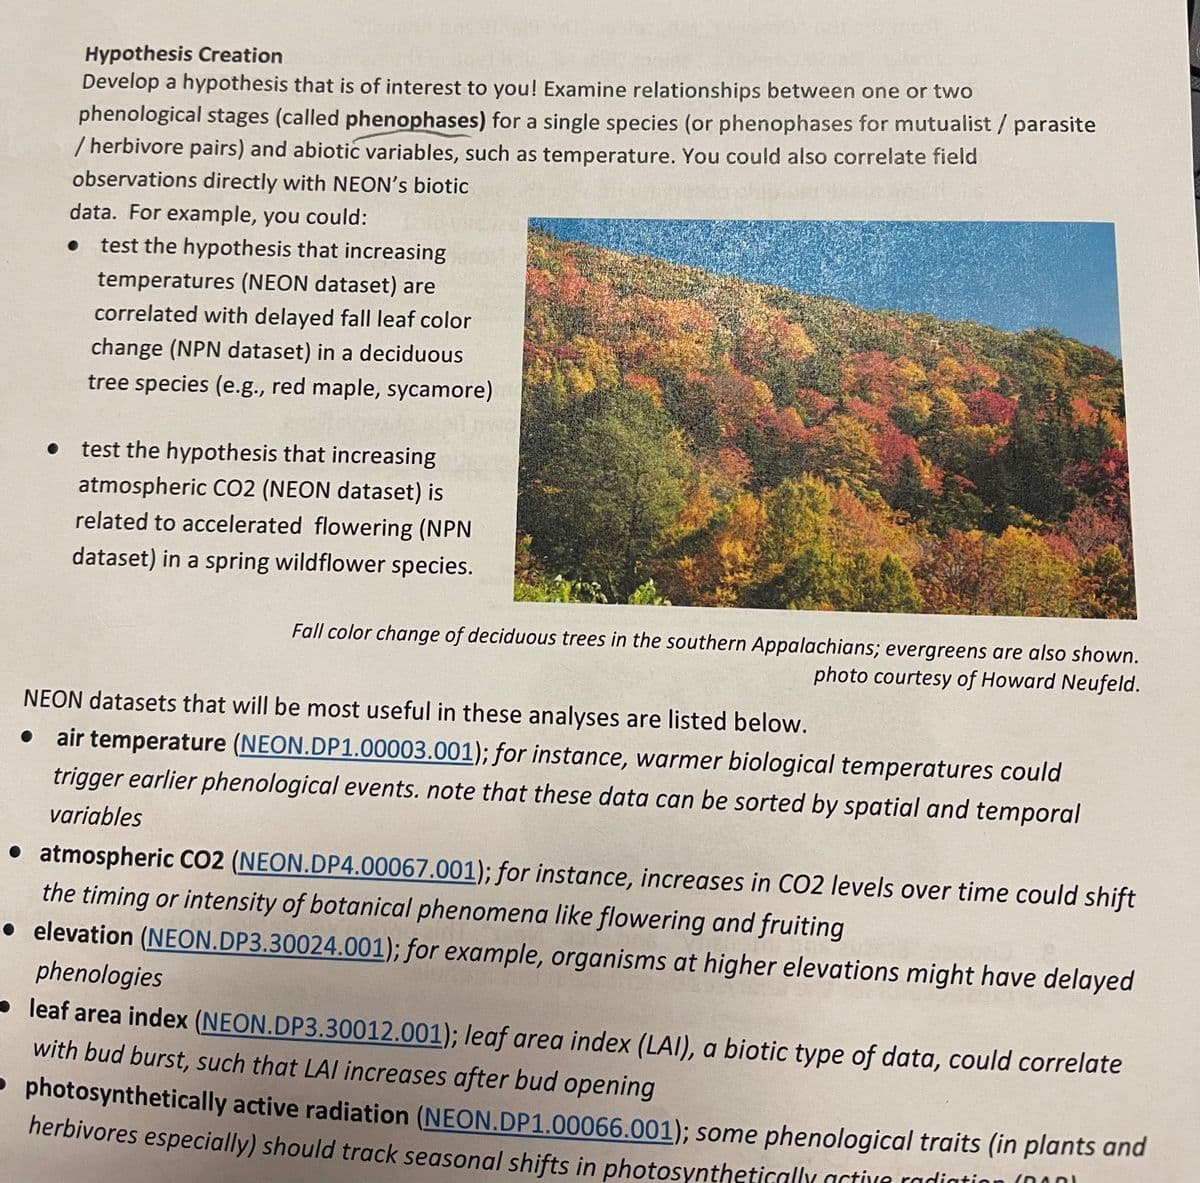
Fall color change of deciduous trees in the southern Appalachians; evergreens are also shown.
photo courtesy of Howard Neufeld.
NEON datasets that will be most useful in these analyses are listed below.
air temperature (NEON.DP1.00003.001); for instance, warmer biological temperatures could
trigger earlier phenological events. note that these data can be sorted by spatial and temporal
variables
• atmospheric CO2 (NEON.DP4.00067.001); for instance, increases in CO2 levels over time could shift
the timing or intensity of botanical phenomena like flowering and fruiting
• elevation (NEON.DP3.30024.001); for example, organisms at higher elevations might have delayed
phenologies
leaf area index (NEON.DP3.30012.001); leaf area index (LAI), a biotic type of data, could correlate
with bud burst, such that LAI increases after bud opening
photosynthetically active radiation (NEON.DP1.00066.001); some phenological traits (in plants and
herbivores especially) should track seasonal shifts in photosynthetically active radiation (al
www
Expert Solution
This question has been solved!
Explore an expertly crafted, step-by-step solution for a thorough understanding of key concepts.
This is a popular solution!
Trending now
This is a popular solution!
Step by step
Solved in 3 steps

Knowledge Booster
Learn more about
Need a deep-dive on the concept behind this application? Look no further. Learn more about this topic, biology and related others by exploring similar questions and additional content below.Recommended textbooks for you

Biology (MindTap Course List)
Biology
ISBN:
9781337392938
Author:
Eldra Solomon, Charles Martin, Diana W. Martin, Linda R. Berg
Publisher:
Cengage Learning

Biology: The Dynamic Science (MindTap Course List)
Biology
ISBN:
9781305389892
Author:
Peter J. Russell, Paul E. Hertz, Beverly McMillan
Publisher:
Cengage Learning

Biology 2e
Biology
ISBN:
9781947172517
Author:
Matthew Douglas, Jung Choi, Mary Ann Clark
Publisher:
OpenStax

Biology (MindTap Course List)
Biology
ISBN:
9781337392938
Author:
Eldra Solomon, Charles Martin, Diana W. Martin, Linda R. Berg
Publisher:
Cengage Learning

Biology: The Dynamic Science (MindTap Course List)
Biology
ISBN:
9781305389892
Author:
Peter J. Russell, Paul E. Hertz, Beverly McMillan
Publisher:
Cengage Learning

Biology 2e
Biology
ISBN:
9781947172517
Author:
Matthew Douglas, Jung Choi, Mary Ann Clark
Publisher:
OpenStax