Hypothesis Test for Difference in Population Means (o Unknown) You wish to test the following claim (Ha) at a significance level of a = 0.05. Ho:41 = 42 T11 > Irt : "H You believe both populations are normally distributed, but you do not know the standard deviations for either. We will assume that the population variances are not equal. You obtain a sample of size n = 10 with a mean of M1 = 74.2 and a standard deviation of SD = 12.8 from the first population. You obtain a sample of size n2 = 26 with a mean of M2 = 79.3 and a standard deviation of SD2 = 20.3 from the second population. l What is the test statistic for this sample? (Report answer accurate to three decimal places.) test statistic = What is the p-value for this sample? For this calculation, use the conservative under-estimate for the degrees of freedom. The degrees of freedom is the minimum of ng - 1 and n2 - 1. (Report answer accurate to four decimal places.) p-value - The p-value is... less than (or equal to) a O greater than a This test statistic leads to a decision to... O reject the null accept the null O fail to reject the null
Hypothesis Test for Difference in Population Means (o Unknown) You wish to test the following claim (Ha) at a significance level of a = 0.05. Ho:41 = 42 T11 > Irt : "H You believe both populations are normally distributed, but you do not know the standard deviations for either. We will assume that the population variances are not equal. You obtain a sample of size n = 10 with a mean of M1 = 74.2 and a standard deviation of SD = 12.8 from the first population. You obtain a sample of size n2 = 26 with a mean of M2 = 79.3 and a standard deviation of SD2 = 20.3 from the second population. l What is the test statistic for this sample? (Report answer accurate to three decimal places.) test statistic = What is the p-value for this sample? For this calculation, use the conservative under-estimate for the degrees of freedom. The degrees of freedom is the minimum of ng - 1 and n2 - 1. (Report answer accurate to four decimal places.) p-value - The p-value is... less than (or equal to) a O greater than a This test statistic leads to a decision to... O reject the null accept the null O fail to reject the null

MATLAB: An Introduction with Applications
6th Edition
ISBN:9781119256830
Author:Amos Gilat
Publisher:Amos Gilat
Chapter1: Starting With Matlab
Section: Chapter Questions
Problem 1P

Related questions
Question
Transcribed Image Text:9:27
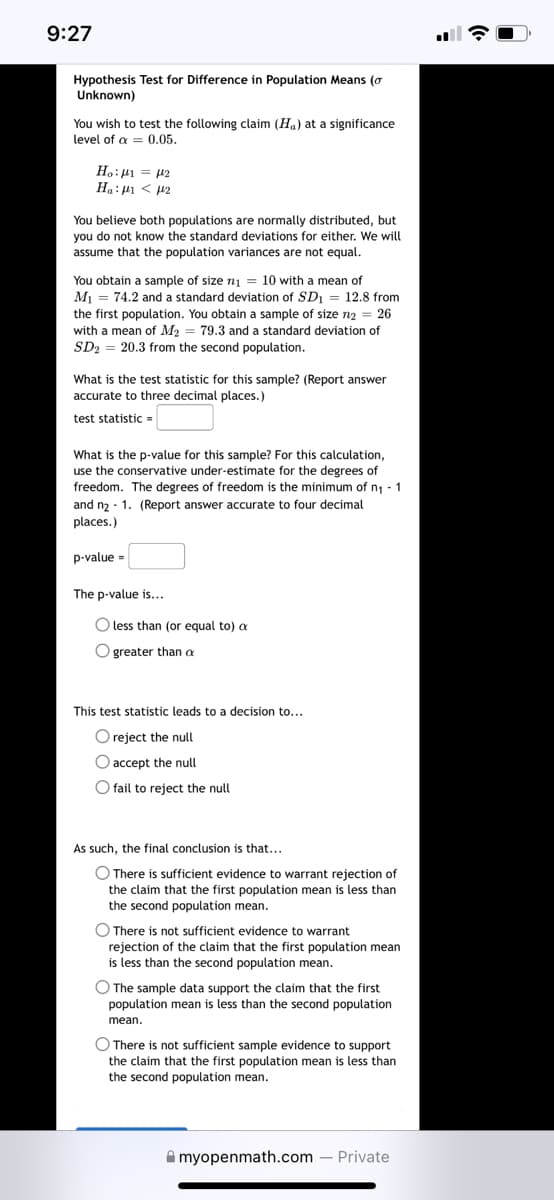
Hypothesis Test for Difference in Population Means (o
Unknown)
You wish to test the following claim (Ha) at a significance
level of a = 0.05.
Ho:41 = 42
T1 > It: "H
You believe both populations are normally distributed, but
you do not know the standard deviations for either. We will
assume that the population variances are not equal.
You obtain a sample of size nj = 10 with a mean of
M1 = 74.2 and a standard deviation of SD1 = 12.8 from
the first population. You obtain a sample of size n2 = 26
with a mean of M2 = 79.3 and a standard deviation of
SD2 = 20.3 from the second population.
What is the test statistic for this sample? (Report answer
accurate to three decimal places.)
test statistic =
What is the p-value for this sample? For this calculation,
use the conservative under-estimate for the degrees of
freedom. The degrees of freedom is the minimum of n - 1
and n2 - 1. (Report answer accurate to four decimal
places.)
p-value =
The p-value is...
O less than (or equal to) a
O greater than a
This test statistic leads to a decision to...
O reject the null
O accept the null
O fail to reject the null
As such, the final conclusion is that...
O There is sufficient evidence
rejection of
the claim that the first population mean is less than
the second population mean.
O There
s not sufficient evidence to warrant
rejection of the claim that the first population mean
is less than the second population mean.
O The sample data support the claim that the first
population mean is less than the second population
mean.
O There is not sufficient sample evidence to support
the claim that the first population mean is less than
the second population mean.
A myopenmath.com – Private
Expert Solution
This question has been solved!
Explore an expertly crafted, step-by-step solution for a thorough understanding of key concepts.

Step by step
Solved in 2 steps with 1 images

Recommended textbooks for you
MATLAB: An Introduction with Applications
Statistics
ISBN:
9781119256830
Author:
Amos Gilat
Publisher:
John Wiley & Sons Inc

Probability and Statistics for Engineering and th…
Statistics
ISBN:
9781305251809
Author:
Jay L. Devore
Publisher:
Cengage Learning

Statistics for The Behavioral Sciences (MindTap C…
Statistics
ISBN:
9781305504912
Author:
Frederick J Gravetter, Larry B. Wallnau
Publisher:
Cengage Learning
MATLAB: An Introduction with Applications
Statistics
ISBN:
9781119256830
Author:
Amos Gilat
Publisher:
John Wiley & Sons Inc
Probability and Statistics for Engineering and th…
Statistics
ISBN:
9781305251809
Author:
Jay L. Devore
Publisher:
Cengage Learning
Statistics for The Behavioral Sciences (MindTap C…
Statistics
ISBN:
9781305504912
Author:
Frederick J Gravetter, Larry B. Wallnau
Publisher:
Cengage Learning

Elementary Statistics: Picturing the World (7th E…
Statistics
ISBN:
9780134683416
Author:
Ron Larson, Betsy Farber
Publisher:
PEARSON

The Basic Practice of Statistics
Statistics
ISBN:
9781319042578
Author:
David S. Moore, William I. Notz, Michael A. Fligner
Publisher:
W. H. Freeman

Introduction to the Practice of Statistics
Statistics
ISBN:
9781319013387
Author:
David S. Moore, George P. McCabe, Bruce A. Craig
Publisher:
W. H. Freeman