i A new method was developed to reduce variability of test scores by eliminating lower scores. Two groups, one called the control group and the other, the experimental group, both took the same test. The experimental group was taught using the new method. Do the data provide sufficient evidence to conclude that there is less variation among scores when the new method is used? Perform an F-test at the 1% significance level. (Note: s, = 6.3 and Control Experimental 30 19 29 26 33 36 29 18 33 33 18 19 31 S2 = 3.3.) 32 27 32 29 30 33 ..... 3.704 (Round to three decimal places as needed.) Find the critical value(s). The critical value(s) is(are). (Round to two decimal places as needed. Use a comma to separate answers as needed.) Interpret the results of the hypothesis test. Choose the correct answer below. O A. Reject H. The data do provide sufficient evidence to conclude that there is less variation among scores with the new method. cents O B. Reject Ho. The data do not provide sufficient evidence to conclude that there is less variation among scores with the new method. O C. Do not reject Ho. The data do not provide sufficient evidence to conclude that there is less variation among scores with the new method. O D. Do not reject Ho. The data do provide sufficient evidence to conclude that there is less variation among scores with the new method.
i A new method was developed to reduce variability of test scores by eliminating lower scores. Two groups, one called the control group and the other, the experimental group, both took the same test. The experimental group was taught using the new method. Do the data provide sufficient evidence to conclude that there is less variation among scores when the new method is used? Perform an F-test at the 1% significance level. (Note: s, = 6.3 and Control Experimental 30 19 29 26 33 36 29 18 33 33 18 19 31 S2 = 3.3.) 32 27 32 29 30 33 ..... 3.704 (Round to three decimal places as needed.) Find the critical value(s). The critical value(s) is(are). (Round to two decimal places as needed. Use a comma to separate answers as needed.) Interpret the results of the hypothesis test. Choose the correct answer below. O A. Reject H. The data do provide sufficient evidence to conclude that there is less variation among scores with the new method. cents O B. Reject Ho. The data do not provide sufficient evidence to conclude that there is less variation among scores with the new method. O C. Do not reject Ho. The data do not provide sufficient evidence to conclude that there is less variation among scores with the new method. O D. Do not reject Ho. The data do provide sufficient evidence to conclude that there is less variation among scores with the new method.

MATLAB: An Introduction with Applications
6th Edition
ISBN:9781119256830
Author:Amos Gilat
Publisher:Amos Gilat
Chapter1: Starting With Matlab
Section: Chapter Questions
Problem 1P

Related questions
Question
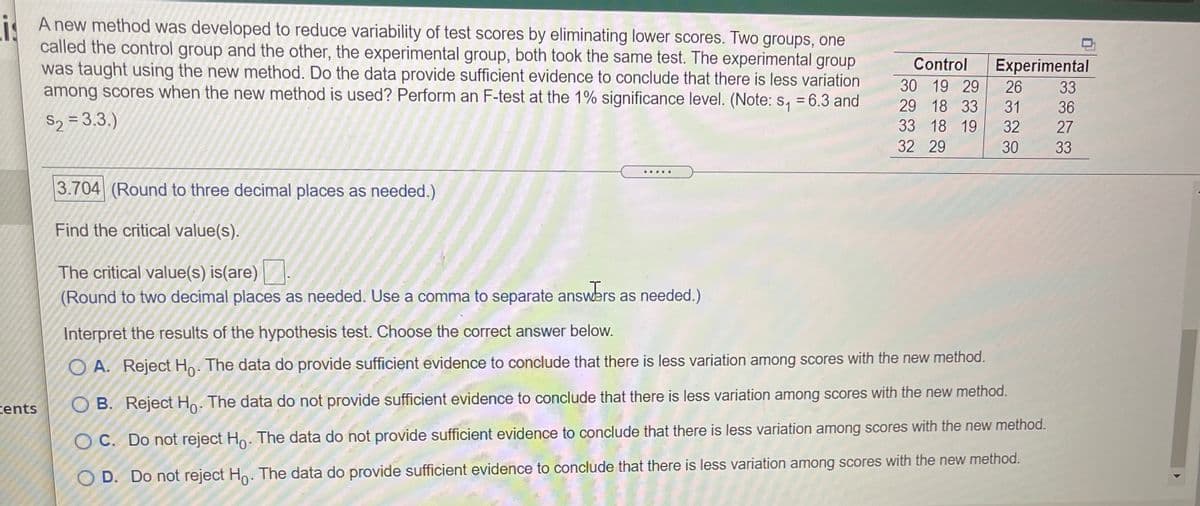
Transcribed Image Text:i A new method was developed to reduce variability of test scores by eliminating lower scores. Two groups, one
called the control group and the other, the experimental group, both took the same test. The experimental group
was taught using the new method. Do the data provide sufficient evidence to conclude that there is less variation
among scores when the new method is used? Perform an F-test at the 1% significance level. (Note: s, = 6.3 and
Control
Experimental
30 19 29
26
33
29 18 33
31 36
S2 = 3.3.)
33 18 19
32 27
32 29
30
33
... .
3.704 (Round to three decimal places as needed.)
Find the critical value(s).
The critical value(s) is(are).
(Round to two decimal places as needed. Uşe a comma to separate answers as needed.)
Interpret the results of the hypothesis test. Choose the correct answer below.
O A. Reject Ho. The data do provide sufficient evidence to conclude that there is less variation among scores with the new method.
tents
O B. Reject Ho. The data do not provide sufficient evidence to conclude that there is less variation among scores with the new method.
O C. Do not reject Ho. The data do not provide sufficient evidence to conclude that there is less variation among scores with the new method.
O D. Do not reject Ho. The data do provide sufficient evidence to conclude that there is less variation among scores with the new method.
Expert Solution
This question has been solved!
Explore an expertly crafted, step-by-step solution for a thorough understanding of key concepts.

This is a popular solution!

Trending now
This is a popular solution!

Step by step
Solved in 3 steps with 2 images

Recommended textbooks for you
MATLAB: An Introduction with Applications
Statistics
ISBN:
9781119256830
Author:
Amos Gilat
Publisher:
John Wiley & Sons Inc

Probability and Statistics for Engineering and th…
Statistics
ISBN:
9781305251809
Author:
Jay L. Devore
Publisher:
Cengage Learning

Statistics for The Behavioral Sciences (MindTap C…
Statistics
ISBN:
9781305504912
Author:
Frederick J Gravetter, Larry B. Wallnau
Publisher:
Cengage Learning
MATLAB: An Introduction with Applications
Statistics
ISBN:
9781119256830
Author:
Amos Gilat
Publisher:
John Wiley & Sons Inc
Probability and Statistics for Engineering and th…
Statistics
ISBN:
9781305251809
Author:
Jay L. Devore
Publisher:
Cengage Learning
Statistics for The Behavioral Sciences (MindTap C…
Statistics
ISBN:
9781305504912
Author:
Frederick J Gravetter, Larry B. Wallnau
Publisher:
Cengage Learning

Elementary Statistics: Picturing the World (7th E…
Statistics
ISBN:
9780134683416
Author:
Ron Larson, Betsy Farber
Publisher:
PEARSON

The Basic Practice of Statistics
Statistics
ISBN:
9781319042578
Author:
David S. Moore, William I. Notz, Michael A. Fligner
Publisher:
W. H. Freeman

Introduction to the Practice of Statistics
Statistics
ISBN:
9781319013387
Author:
David S. Moore, George P. McCabe, Bruce A. Craig
Publisher:
W. H. Freeman