I am producing 400-gram loạf breads in one of my production lines and measured the weights of 28 loaf breads from the same batch as shown in table below. 400 402 390 405 387 408 400 401 394 403 402 412 409 399 411 388 397 400 394 406 407 389 413 396 398 405 403 397 A. Summarize data in a frequency distribution table using a 5-gram interval. B. Illustrate data in a frequency histogram using a 5-gram interval. C. Compute for relative frequency of 3rd interval and cumulative relative frequency of the 4th interval. UCompute for the mean and median of the sample data
I am producing 400-gram loạf breads in one of my production lines and measured the weights of 28 loaf breads from the same batch as shown in table below. 400 402 390 405 387 408 400 401 394 403 402 412 409 399 411 388 397 400 394 406 407 389 413 396 398 405 403 397 A. Summarize data in a frequency distribution table using a 5-gram interval. B. Illustrate data in a frequency histogram using a 5-gram interval. C. Compute for relative frequency of 3rd interval and cumulative relative frequency of the 4th interval. UCompute for the mean and median of the sample data

Mathematics For Machine Technology
8th Edition
ISBN:9781337798310
Author:Peterson, John.
Publisher:Peterson, John.
Chapter29: Tolerance, Clearance, And Interference
Section: Chapter Questions
Problem 16A: Spacers are manufactured to the mean dimension and tolerance shown in Figure 29-12. An inspector...

Related questions
Question
..............akzkxkskwoaiacjndjejaa..........jsxjsjeiwisidid
Answer A-P. Show complete solutions.....
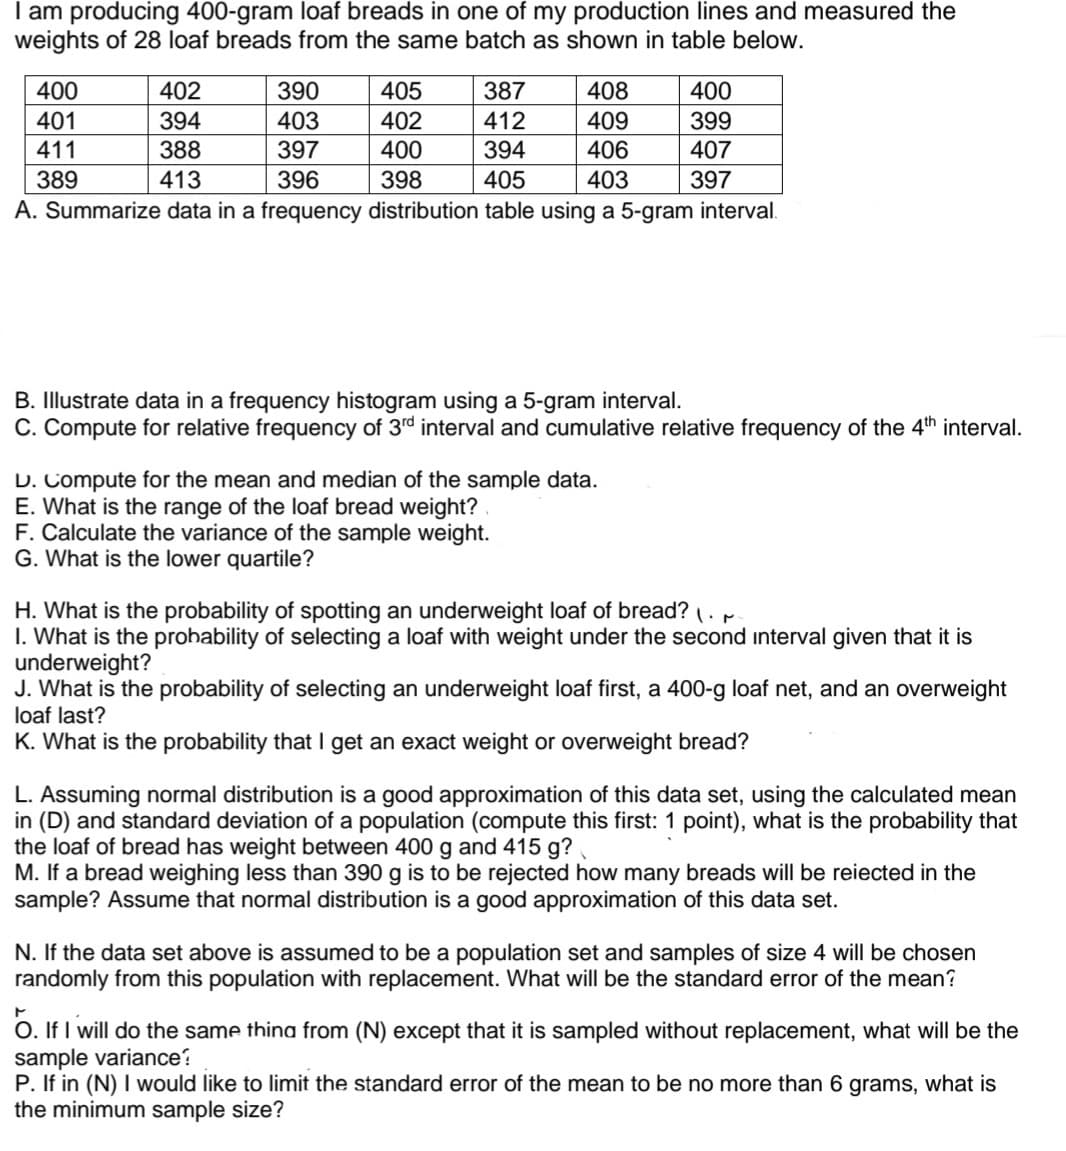
Transcribed Image Text:I am producing 400-gram loaf breads in one of my production lines and measured the
weights of 28 loaf breads from the same batch as shown in table below.
400
402
390
405
387
408
400
401
394
403
402
412
409
399
411
388
397
400
394
406
407
389
413
396
398
405
403
397
A. Summarize data in a frequency distribution table using a 5-gram interval.
B. Illustrate data in a frequency histogram using a 5-gram interval.
C. Compute for relative frequency of 3rd interval and cumulative relative frequency of the 4th interval.
D. Compute for the mean and median of the sample data.
E. What is the range of the loaf bread weight?
F. Calculate the variance of the sample weight.
G. What is the lower quartile?
H. What is the probability of spotting an underweight loaf of bread? .
I. What is the prohability of selecting a loaf with weight under the second interval given that it is
underweight?
J. What is the probability of selecting an underweight loaf first, a 400-g loaf net, and an overweight
loaf last?
K. What is the probability that I get an exact weight or overweight bread?
L. Assuming normal distribution is a good approximation of this data set, using the calculated mean
in (D) and standard deviation of a population (compute this first: 1 point), what is the probability that
the loaf of bread has weight between 400 g and 415 g?
M. If a bread weighing less than 390 g
sample? Assume that normal distribution is a good approximation of this data set.
to be rejected how many breads will be reiected in the
N. If the data set above is assumed to be a population set and samples of size 4 will be chosen
randomly from this population with replacement. What will be the standard error of the mean?
O. If I will do the same thing from (N) except that it is sampled without replacement, what will be the
sample variance?
P. If in (N) I would like to limit the standard error of the mean to be no more than 6 grams, what is
the minimum sample size?
Expert Solution
This question has been solved!
Explore an expertly crafted, step-by-step solution for a thorough understanding of key concepts.

Step by step
Solved in 4 steps with 2 images

Recommended textbooks for you
Mathematics For Machine Technology
Advanced Math
ISBN:
9781337798310
Author:
Peterson, John.
Publisher:
Cengage Learning,
Mathematics For Machine Technology
Advanced Math
ISBN:
9781337798310
Author:
Peterson, John.
Publisher:
Cengage Learning,