I did this question fully but only got the correct answer for 1 a). For b) I didnt get it correct can you locate where I made my mistake for it than redo it explaining everything in it I will paste the picture of full solutions for a) and b) but only help me with b) My question and answers are posted first and the correct solution are in the pictures (only help for (b)) In a data management exam, the scores of 567 participants followed a continuous normal distribution. It is known that the mean from all of the students is 75, and to reach the top 1%, students need to score more than (exactly) 92. a) Estimate the number of students who scored between 60 and 70. Using standard deviation P(X<=92) = P(Z<=X-mean/SD) = P(Z<=92-75/SD) = P(Z<=17/SD) = 0.99 where Z follows standard normal distribution with mean 0 and SD (standard deviation) 1. Using standard normal distribution 17/SD = 2.326 SD (standard deviation) = 17/2.326 = 7.31 Probability that student scores b/w 60 and 70 = P(60


I did this question fully but only got the correct answer for 1 a). For b) I didnt get it correct can you locate where I made my mistake for it than redo it explaining everything in it
I will paste the picture of full solutions for a) and b) but only help me with b)
My question and answers are posted first and the correct solution are in the pictures (only help for (b))
- In a data management exam, the scores of 567 participants followed a continuous
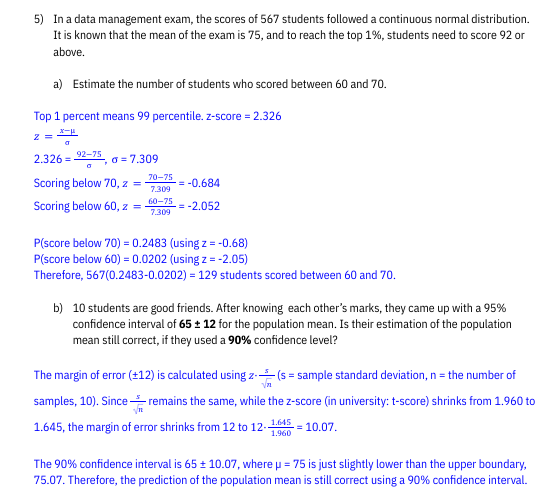
normal distribution . It is known that themean from all of the students is 75, and to reach the top 1%, students need to score more than (exactly) 92.
a) Estimate the number of students who scored between 60 and 70.
Using standard deviation
P(X<=92) = P(Z<=X-mean/SD) = P(Z<=92-75/SD) = P(Z<=17/SD) = 0.99 where Z follows standard normal distribution with mean 0 and SD (standard deviation) 1.
Using standard normal distribution
17/SD = 2.326
SD (standard deviation) = 17/2.326 = 7.31
Probability that student scores b/w 60 and 70 = P(60<X<70)
Using standardization: P(60<X<70) = P(60-75/7.31 < Z < 70 -75/7.31) = P(-15/7.31 < Z -5/7.31) = 0.2268
Number of students scoring b/w 60 and 70 = 567*0.2268 = 128.5956 = 129
b) 10 students are good friends. After knowing each other’s marks, they came up with a 95% confidence interval of 65 ± 12 for the population mean. Is their estimation of the population mean still correct, if they used a 90% confidence level?
Given 95% CI is 65±12 = (53, 77)
It means that we are 95% (more than 90%) confident that the true mean score lies b/w 53 and 77.
And the true mean score i.e., 75 lies in the given confident interval.
we cannot conclude that these students performed worse than average with 90% confidence.

Step by step
Solved in 2 steps


