(i) Explain the Type 1 error and Type 2 Error. Identify the null and alternate hypothesis (ii) Test the claim at 5% level of confidence coefficient.
Q: Which of the following can help identify special cause variation in a process? a. capability…
A: Control chart
Q: suppose that IQ scores in one region are normally distributed with a standard deviation of 18 .…
A: Given Standard deviations=18
Q: Direction: Calculate Spearman's coefficient of rank correlation for the following. Describe the…
A: The question is about correlation Given : 1 ) 2 )
Q: Suppose Z follows the standard normal distribution. Use the calculator provided, or this table,…
A: Answer:- Given the standard normal distribution. Determine the value of c so that the following is…
Q: Why is sampling design needed in research?
A: Everyone who has ever worked on a research project knows that resources are limited; time, money and…
Q: A researcher collected data on how much extra sleep subjects got after being placed into one of two…
A: R code: Output:
Q: software
A: The confidence interval I1,I2,...Im for parameters θ1,θ2...θm In the analysis of variance problem…
Q: The amount of syrup that people put on their pancakes is normally distributed with mean 59 mL and…
A:
Q: A random selection of volunteers at a research institute have been exposed to a typical cold virus.…
A:
Q: Suppose in a certain state there were 40 tornadoes in the last 25 years. Using the Poisson…
A:
Q: You may need to use the appropriate appendix table or technology to answer this question. A magazine…
A: The question is about confidence interval Given : Total no. of ships that carry fewer than 500…
Q: The accompanying data represent the miles per gallon of a random sample of cars with a…
A: "Since you have a question with multiple sub-parts, we'll solve the first three sub-parts for you.…
Q: branch randomly assigned half of their 5000 students enrolled this year to receive the new teaching…
A: Given, For Conventional teaching method: sample size (n1) = 100 x1 = 78 sample proportion (p1^) =…
Q: 5. a) How many ways can 6 people be lined up to get on a bus? b) If a certain 3 persons insist on…
A: Given numbers of people. 6 people
Q: You want to obtain a sample to estimate a population proportion. Based on previous evidence, you…
A: It is given that margin of error (E) is 0.045 and the confidence level is 0.90.
Q: The data were collected from a statistics class. The column head gives the variable, and each of the…
A:
Q: 16. Hout, Duncan, and Sobel (1987) reported on the relative sexual satisfaction of heterosexual…
A: Solution: In the given example the relative sexual satisfaction of the wife and the husband are…
Q: How do you calculate the upper quartile when you have missing data in the column age in the dataset…
A:
Q: A factory collected data on the number of nonconforming parts to construct an np-chart. 15 samples…
A: Control chart
Q: Independent t-test is an example of what kind of test? Probability, Parametric, Paranormal, or…
A: An Independent t-test is an example of a Parametric test.
Q: the decision rule for any kind of test is? A. reject the Ho if the p-value associated with the…
A: From the given information we want to know correct statement.
Q: The average number of miles (in thousands) that a car's tire will function before needing…
A: Given Information: Mean μ=73 Standard deviation σ=19 Sample size n=45
Q: Complete parts (a) through (c) below. (a) Determine the critical value(s) for a right-tailed test of…
A:
Q: An aptitude test is designed to measure leadership abilities of the test subjects. Suppose that the…
A: Solution Given that An aptitude test is designed to measure leadership abilities of the test…
Q: 1. A company manufactures LCD monitors, which have a lifespan that is approximately normally…
A: As per our guidelines we are suppose to answer only one question1)GivenMean(x)=180standard…
Q: The FBI wants to determine the effectiveness of their 10 most wanted list. To do so, they need to…
A: The following information has been provided: The sample size is n=531. The number of occurrences…
Q: Jeremiah gathers data on the driving experience of his classmates. To that end, he asks his…
A: The question is about types of data Given :
Q: A student conducted a test to see if people preferred one of two possible new logos for UF, one with…
A: Confidence interval is a technique of estimation.
Q: a. Compute the least squares regression line. b. On average, for each additional thousand dollars…
A: here given x= advertising expenditure (in thousands of dollars ) y = sale (in thousands of dollars…
Q: Stress at work: In a poll about work,44%of respondents said that their jobs were sometimes or always…
A: If an experiment has only two outcomes, they follow bernoulli distribution. If the experiment is…
Q: The mean amount of time it takes a kidney stone to pass is 13 days and the standard deviation is 5…
A: GivenMean(μ)=13standard deviation(σ)=5
Q: Relevant Relationship: There is a functional relationship between Price of an IPod Touch,p and…
A: Given data: Price (p) Weekly Demand (s) 150 210 170 203 190 199 210 183 230 185 250…
Q: A. What is the pooled variance? (Hint: you must first find the variance for each Group.) B. What is…
A: Given that: Group A Group B 12 10 10 9 7 4 7 3 8 5 5 4 n = n1 = n2 = 6
Q: The accompanying pie chart reports the number of hours of sleep "last night" for 119 college…
A: There are various types of graph that are constructed to visualize the data. To visualize the…
Q: 2. Ten randomly selected gold mines produced 21, 19, 20, 22, 24, 21, 19, 22, 22, and 20 barrels of…
A: Solution-: Given: μ0=22.5,α=0.01 (or 1%) Given data: 21,19,20,22,24,21,19,22,22,20 Is this enough…
Q: Refer to the accompanying graph, which shows the time spent on a typical day talking on the cell…
A: When the data points are collected in groups or categories then the term used to represent the data…
Q: 3. Classify the following examples of data as either true or false: b. Current grade point average…
A: The discrete data essentially includes the quantitative values, which are assumed to be countable…
Q: Use the following information to find the 85% confidence interval to estimate ₁-2. Assume x is…
A:
Q: According to analysis of variance, there are assumptions to follow when choosing the right…
A: Given:Violation of assumption (test of homogeneity) of ANOVA test then we can use then we can use…
Q: You may need to use the appropriate appendix table or technology to answer this question. A survey…
A:
Q: D. Graph the following regression lines. - y = 0.3x + 2.5
A:
Q: Today, the waves are crashing onto the beach every 4.9 seconds. The times from when a person arrives…
A:
Q: Two sections of statistics are offered, the first at 8 a.m. and the second at 10 a.m. The 8 a.m.…
A: From the given problem. There are two sections of statistics are offered.The first 8 amd anf second…
Q: 1) Let X be a discrete random variable with the following PMF 0.1 for x = 0.2 0.2 for x = 0.4 0.2…
A: Since you have asked multiple questions, we will solve the first question for you. If you want any…
Q: The Credit Risk Department of a major bank estimates the default rate on loans under $10,000 to be…
A: Given data: Proportion = 1% = 0.01 Sample size (n) = 1100
Q: 1. What is the main source of qualitative data? between 2. What are the differences qualitative and…
A: Data are the basic material needed for effective statistical inference and decision-making on a…
Q: Temperature in degrees Fahrenheit has been collected from a sample of 50 individuals. The mean is…
A: Given n=50, sample mean x̄=98.5, standard deviations σx=3.2
Q: 6. The effects of two catalysts on the mean yield of a chemical process are being investigated. UA…
A: We have given that, the Claim difference is there is difference between the mean yields from the two…
Q: A company manufactures LCD monitors, which have a lifespan that is approximately normally…
A: We have given that, Sample mean or average (x̄) = 180 months, standard deviation (s) = 96 months…
Q: 1. a. Two fair dice are rolled at once. Let X denote the difference in the number of dots that…
A: A discrete random variable is a variable whose values can be obtained by counting. Though, the…
PLEASE ANSWER QUICKLY
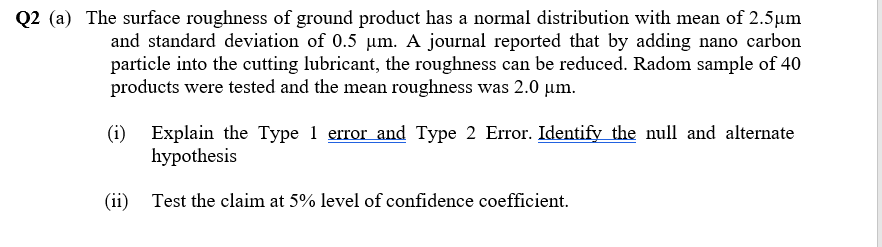
Step by step
Solved in 3 steps
- A study was carried out to find out if the increase in substrate concentration has an appreciable effect on the rate of a chemical reaction. With a substrate concentration of 1.5 moles per liter, the reaction was performed 15 times, with an average rate of 7.5 micromoles per 30 minutes and a standard deviation of 1.5. With a substrate concentration of 2.0 moles per liter, 12 reactions were performed, yielding an average rate of 8.8 micromoles per 30 minutes and a sample standard deviation of 1.2. Is there any reason to believe that this increase in substrate concentration is due to an increase in the rate of reaction?reason to believe that this increase in substrate concentration causes an increase in the average reaction rate of more than 0.5 micromoles per 30 minutes? Use a significance level of 0.01 and assume that the populations are approximately normally distributed with equal variances.1. The parameter of interest is:2. The hypotheses for this test are:3. The calculated test…A particular brand of tires claims that its deluxe tire averages at least 50,000 miles before it needs to be replaced. From past studies of this tire, the population standard deviation is known to be 8,000. A survey of owners of that tire design is conducted. Of the 29 tires surveyed, the mean lifespan was 45,600 miles . Using alpha = 0.05, is the data highly consistent with the claim?Note: If you are using a Student's t-distribution for the problem, you may assume that the underlying population is normally distributed. (In general, you must first prove that assumption, though.) I also need a graph made with 95% confidence levelA laboratory claims that the mean sodium level, μ of a healthy adult is 140 mEq per liter of blood. To test this claim, a random sample of 100 adult patients is evaluated. The mean sodium level for the sample is 139 mEq per liter of blood. It is known that the population standard deviation of adult sodium levels is 12 mEq. Can we conclude, at the 0.05 level of significance, that the population mean adult sodium level differs from that claimed by the laboratory? Perform a two-tailed test. Then fill in the table below. Carry your intermediate computations to at least three decimal places, and round your responses as specified in the table. The null hypothesis: H0: __? The alternative hypothesis: H1: __? The type of test statistic: (Choose one)Z,t,Chi square,F The value of the test statistic:(Round to at least three decimal places.) __? The p-value:(Round to at least three decimal places.) __? Can we conclude that the population mean…
- A study was conducted to see if increasing the substrate concentration has an appreciable effect on the velocity of a chemical reaction. With a substrate concentration of 1.6 moles per liter, the reaction was run 16 times, with an average velocity of 7.7 micromoles per 30 minutes and a standard deviation of 1.6. With a substrate concentration of 1.9 moles per liter, 12 runs were made, yielding an average velocity of 8.9 micromoles per 30 minutes and a sample standard deviation of 1.2. Is there any reason to believe that this increase in substrate concentration cause an increase in the mean velocity of the reaction of more than 0.5 micromole per 30 minutes? Use alpha 0.01A laboratory claims that the mean sodium level, µ, of a healthy adult is 138 mEq per liter of blood. To test claim, a random sample of 100 adult patients is evaluated. The mean sodium level for the sample is 137 mEq per liter of blood. It is known that the population standard deviation of adult sodium levels is 11 mEq. Can we conclude, at the 0.01 level of significance, that the population mean adult sodium level differs from that claimed by the laboratory? Perform a two-tailed test. Then fill in the table below. Carry your intermediate computations to at least three decimal places, and round your responses as specified in the table. The null hypothesis: H0 : _____ The alternative hypothesis: H1: ______ The type of test statistic: (choose one) _______ The value of the test statistic: ______ (round to at least three decimal places.) The p-value: _____ (round to at least three decimal places.) Can we conclude that the population mean adult sodium level differs from…A manufacturer of hard safety hats for construction workers is concerned about the mean and the variation of the forces its helmets transmits to wearers when subjected to an external force. The manufacturer has designed the helmets so that the mean force transmitted by the helmets to the workers is 800 pounds (or less) with a standard deviation to be less than 40 pounds. Tests were run on a random sample of n = 40 helmets, and the sample mean and sample standard deviation were found to be 825 pounds and 48.5 pounds, respectively. Do the data provide sufficient evidence, at the α = 0.05 level, to conclude that the population standard deviation exceeds 40 pounds? What is the test statistic?
- In a manufacturing industry, the amounts which go into raw materials (Scraps) aresupposed to be normally distributed with mean GHC 36. and standard deviation GHC0.1. Once every 30 minutes a scrap is selected from the production line, and its contentsare noted precisely. If the amount of the scrap goes below GHC 35.8. or above GHC36.2, then the scrap will be declared out of control.i) If the process is in control, meaning μ = GHC 36.00. and σ = GHC.0.1, find theprobability that a scrap will be declared out of control. ii) In the situation of (i), find the probability that the number of scraps found out ofcontrol in an 8hrs day (16 inspections) will be zero. iii) In the situation of (i), find the probability that the number of scraps found out ofcontrol in an 8hrs day (16 inspections) will be exactly one. iv) If the process shifts so that μ = GHC 37 and σ = GHC 0.4, find the probability thata scrap will be declared out of control.LOUIS VUITTON Company is trying to decide whether to open a store at Bagdat street in Istanbul. Based on their previous research, its stores will be successful in regions of this size if the mean monthly family income is above 30.000 TL. The standard deviation of monthly family income in Bagdat street region is assumed to be 2.000 TL. A random sample of 25 people was obtained, and the mean monthly income was found to be 31.000 TL. Based on this sample evidence, what should LOUIS VUITTON Company decide? Explain briefly.An engineer has designed a valve that will regulate water pressure on an automobile engine. The valve was tested on 160 engines and the mean pressure was 4.1 lbs/square inch. Assume the variance is known to be 0.64 If the valve was designed to produce a mean pressure of 4.2 lbs/square inch, is there sufficient evidence at the 0.02 level that the valve performs below the specifications? State the null and alternative hypotheses for the above scenario.