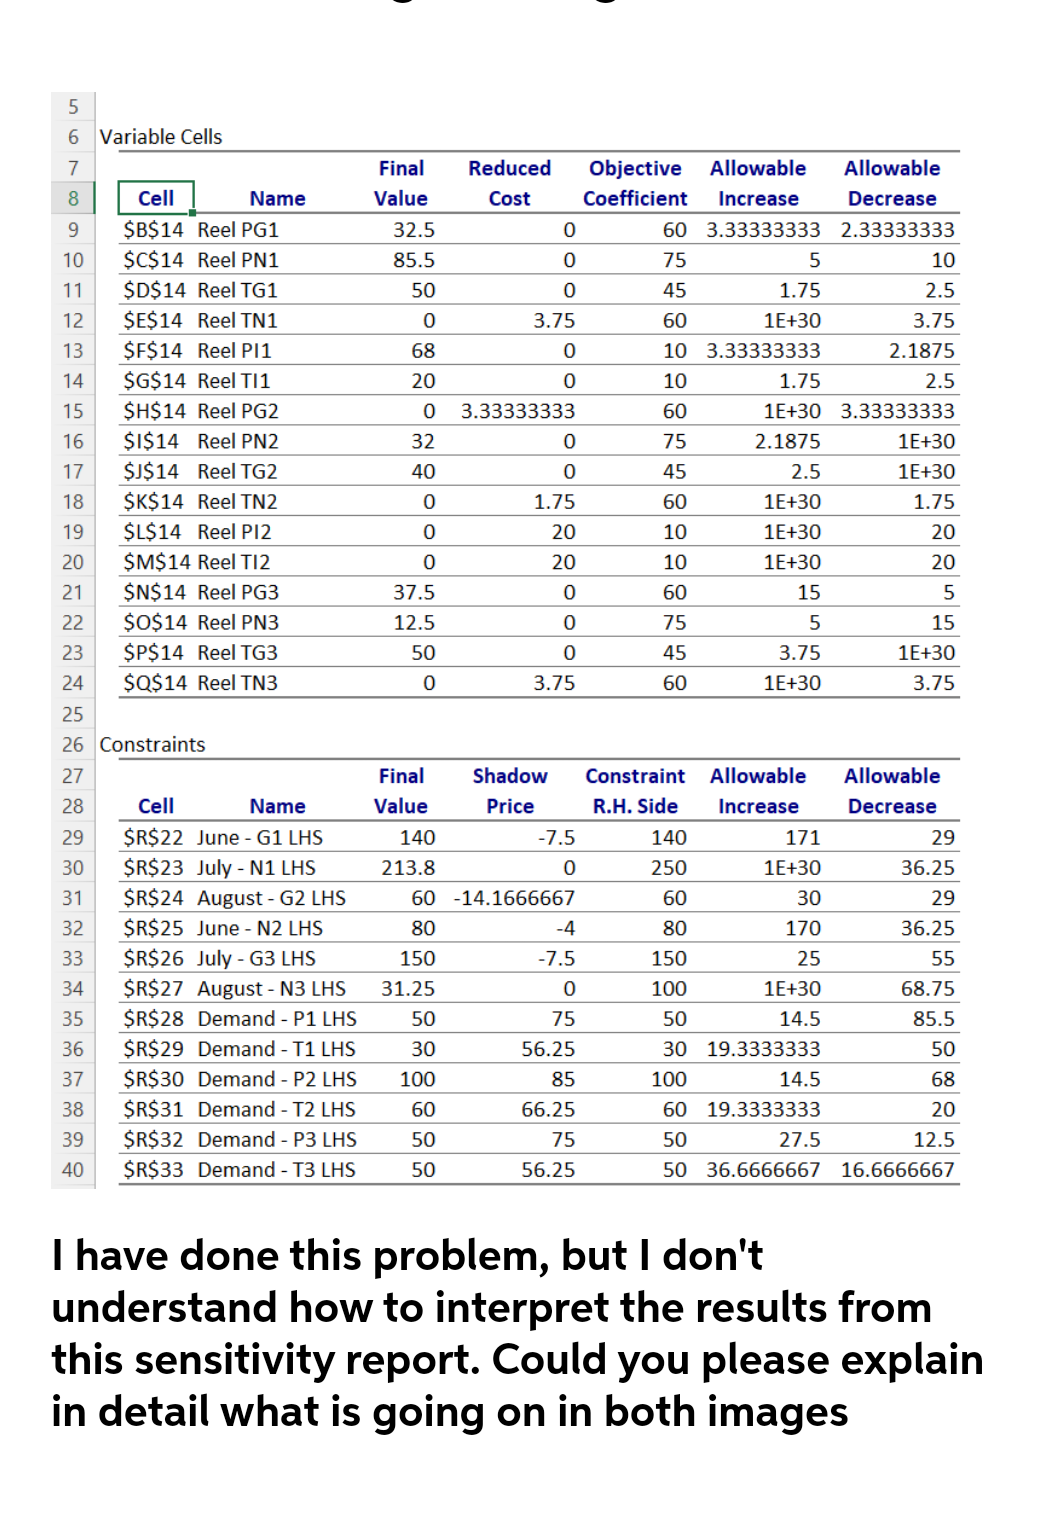
I have done this problem, but I don't understand how to interpret the results from this sensitivity report. Could you please explain
I have done this problem, but I don't understand how to interpret the results from this sensitivity report. Could you please explain
Chapter5: Operating Activities: Purchases And Cash Payments
Section: Chapter Questions
Problem 2.1C
Related questions
Question

Transcribed Image Text:6 Variable Cells
7
Final
Reduced
Objective
Allowable
Allowable
8
Cell
Name
Value
Cost
Coefficient
Increase
Decrease
$B$14 Reel PG1
32.5
60 3.33333333 2.33333333
$C$14 Reel PN1
$D$14 Reel TG1
10
85.5
75
10
11
50
45
1.75
2.5
12
ŞE$14 Reel TN1
3.75
60
1E+30
3.75
13
$E$14 Reel PI1
68
10 3.33333333
2.1875
14
$G$14 Reel T|1
20
10
1.75
2.5
$H$14 Reel PG2
$I$14 Reel PN2
$I$14 Reel TG2
15
3.33333333
60
1E+30 3.33333333
16
32
75
2.1875
1E+30
17
40
45
2.5
1E+30
18
$K$14 Reel TN2
1.75
60
1E+30
1.75
$L$14 Reel PI2
$M$14 Reel TI2
$N$14 Reel PG3
19
20
10
1E+30
20
20
20
10
1E+30
20
21
37.5
60
15
22
$O$14 Reel PN3
12.5
75
15
23
$P$14 Reel TG3
50
45
3.75
1E+30
24
$Q$14 Reel TN3
3.75
60
1E+30
3.75
25
26 Constraints
27
Final
Shadow
Constraint
Allowable
Allowable
28
Cell
Name
Value
Price
R.H. Side
Increase
Decrease
29
$R$22 June - G1 LHS
140
-7.5
140
171
29
$R$23 July - N1 LHS
$R$24 August - G2 LHS
$R$25 June - N2 LHS
$R$26 July - G3 LHS
30
213.8
250
1E+30
36.25
31
60 -14.1666667
60
30
29
32
80
-4
80
170
36.25
33
150
-7.5
150
25
55
$R$27 August - N3 LHS
$R$28 Demand - P1 LHS
34
31.25
100
1E+30
68.75
35
50
75
50
14.5
85.5
$R$29 Demand - T1 LHS
$R$30 Demand - P2 LHS
$R$31 Demand - T2 LHS
36
30
56.25
30 19.3333333
50
37
100
85
100
14.5
68
38
60
66.25
60 19.3333333
20
39
ŚR$32 Demand - P3 LHS
50
75
50
27.5
12.5
40
ŚR$33 Demand - T3 LHS
50
56.25
50 36.6666667 16.6666667
I have done this problem, but I don't
understand how to interpret the results from
this sensitivity report. Could you please explain
in detail what is going on in both images
Expert Solution
This question has been solved!
Explore an expertly crafted, step-by-step solution for a thorough understanding of key concepts.
Step by step
Solved in 2 steps

Recommended textbooks for you


Survey of Accounting (Accounting I)
Accounting
ISBN:
9781305961883
Author:
Carl Warren
Publisher:
Cengage Learning


Survey of Accounting (Accounting I)
Accounting
ISBN:
9781305961883
Author:
Carl Warren
Publisher:
Cengage Learning