I just need help getting the mean and Standard deviation of each sample

Glencoe Algebra 1, Student Edition, 9780079039897, 0079039898, 2018
18th Edition
ISBN:9780079039897
Author:Carter
Publisher:Carter
Chapter10: Statistics
Section: Chapter Questions
Problem 13PT
icon
Related questions
icon
Concept explainers
Topic Video
Question
100%
I just need help getting the mean and Standard deviation of each sample
Below are values from 4-6 randomly selected items from each of six different populations.
Enter these into six different lists in
your calculator.
Samples from
Population A
Samples from
Population B
Samples from
Population C
42
Samples from
Population X
Samples from
Population Y
Samples from
Population Z
66
44
91
8.
29
59
48
40
76
95
42
57
55
34
69
11
62
49
45
82
28
98
56
53
39
46
20
51
Here is a dot plot of your sample data from A, B, and C:
C
СС с вс ВВ В В ВАА А
A A
10
20
30
40
50
60
70
80
90
100
Does it appear that your samples from A, B, and C come from populations with different
means, or might populations A, B, and C have the same mean?
Here is a dot plot of your sample data from X, Y, and Z:
XY Z z YZ
Z X
Y X
X XY Z
10
20
30
40
50
60
70
80
90
100
Does it appear that your samples from X, Y, and Z come from populations with different
means, or might populations X, Y, and Z have the same mean?
Transcribed Image Text:Below are values from 4-6 randomly selected items from each of six different populations. Enter these into six different lists in your calculator. Samples from Population A Samples from Population B Samples from Population C 42 Samples from Population X Samples from Population Y Samples from Population Z 66 44 91 8. 29 59 48 40 76 95 42 57 55 34 69 11 62 49 45 82 28 98 56 53 39 46 20 51 Here is a dot plot of your sample data from A, B, and C: C СС с вс ВВ В В ВАА А A A 10 20 30 40 50 60 70 80 90 100 Does it appear that your samples from A, B, and C come from populations with different means, or might populations A, B, and C have the same mean? Here is a dot plot of your sample data from X, Y, and Z: XY Z z YZ Z X Y X X XY Z 10 20 30 40 50 60 70 80 90 100 Does it appear that your samples from X, Y, and Z come from populations with different means, or might populations X, Y, and Z have the same mean?
Get the mean and standard deviation of each sample:
STAT>CALC>1: 1-Var Stats
a =
Sa =
Sx =
ア=
Sy =
C =
Sc =
S, =
Perform a 2-tailed, 2-Sample TTest to see if you can conclude u4 + µB
Perform a 2-tailed, 2-Sample TTest to see if you can conclude µx # µy
II
II
Transcribed Image Text:Get the mean and standard deviation of each sample: STAT>CALC>1: 1-Var Stats a = Sa = Sx = ア= Sy = C = Sc = S, = Perform a 2-tailed, 2-Sample TTest to see if you can conclude u4 + µB Perform a 2-tailed, 2-Sample TTest to see if you can conclude µx # µy II II
Expert Solution
Step 1

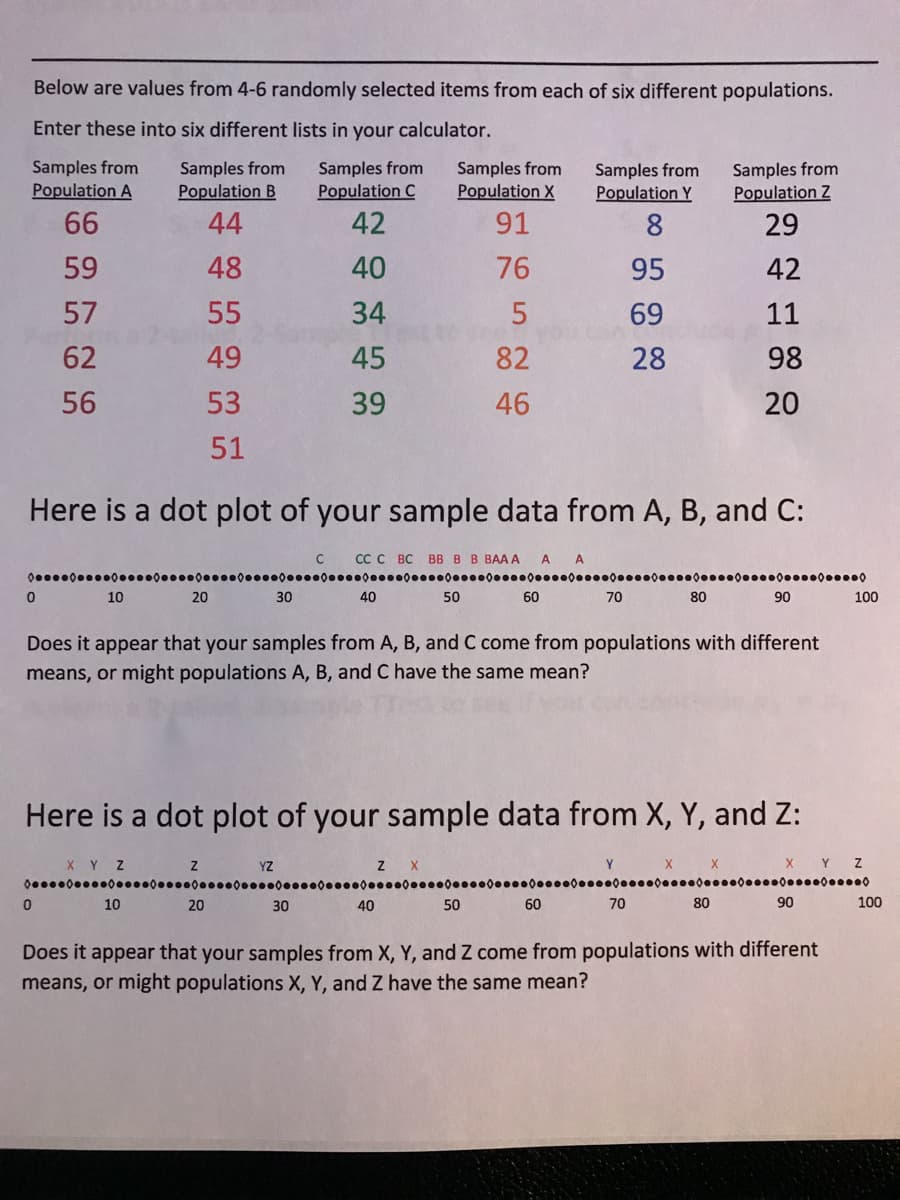
Values from 4-6 randomly selected items from each of six different populations are given as:

Sample from population A

Sample from population B

Sample from population C

Sample from population X

Sample from population Y

Sample from population Z

66

44

42

91

8

29

59

48

40

76

95

42

57

55

34

5

69

11

62

49

45

82

28

98

56

53

39

46


20


51


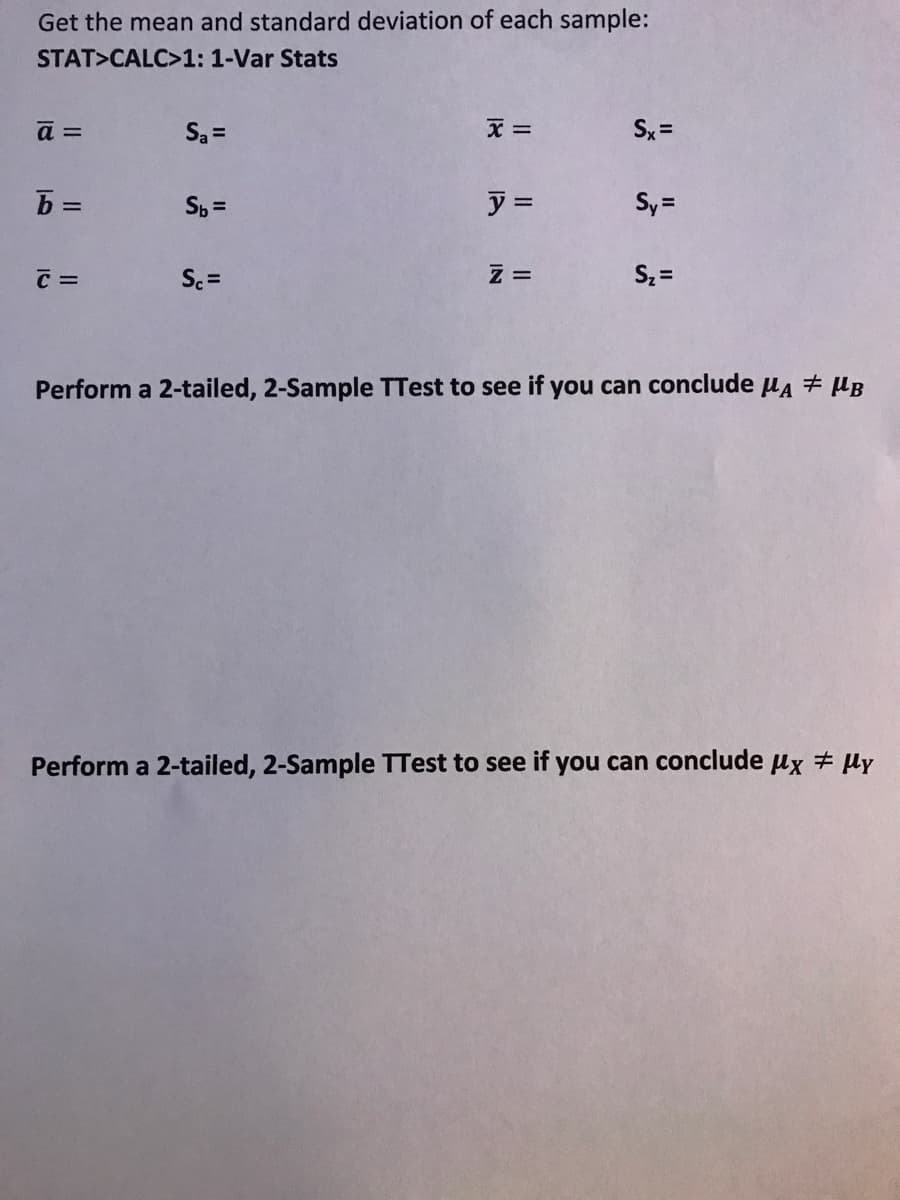
Mean is sum of observations divided by number of observations, calculated as:

x=i=1nxin

Standard deviation: The positive square root of mean of squares of the deviations taken from mean is known as standard deviation.

It is calculated as:

s=i=1nxi-x2n-1


Step 2

Mean for the samples from population A is:

a=66+59+57+62+565=60

Standard deviation for the samples from population A is:

sa=66-602+59-602+57-602+62-602+56-6025-1=4.0620

Mean for the samples from population Bis:

b=44+48+55+49+53+516=50

Standard deviation for the samples from population B is:

sb=44-502+48-502+55-502+49-502+53-502+51-5026-1=3.8987

Mean for the samples from population C is:

c=42+40+34+45+395=40

Standard deviation for the samples from population C is:

sc=42-402+40-402+34-402+45-402+39-4025-1=4.0620

trending now

Trending now

This is a popular solution!

steps

Step by step

Solved in 3 steps

Blurred answer
Knowledge Booster
Centre, Spread, and Shape of a Distribution
Learn more about
Need a deep-dive on the concept behind this application? Look no further. Learn more about this topic, statistics and related others by exploring similar questions and additional content below.
Recommended textbooks for you
Glencoe Algebra 1, Student Edition, 9780079039897…
Algebra
ISBN:
9780079039897
Author:
Carter
Publisher:
McGraw Hill
Holt Mcdougal Larson Pre-algebra: Student Edition…
Algebra
ISBN:
9780547587776
Author:
HOLT MCDOUGAL
Publisher:
HOLT MCDOUGAL
College Algebra (MindTap Course List)
Algebra
ISBN:
9781305652231
Author:
R. David Gustafson, Jeff Hughes
Publisher:
Cengage Learning