I need a boxplot


Q: An online retailer operates two independent warehouses (A & B) where it keeps its inventory. Each…
A: Solution: given that Each warehouse has a .05 probability of experiencing a fire. If a fire is…
Q: (1) (11) (111) Write down the estimated model for the House Size Interpret the coefficients of the…
A: Comment: As per the our company guidelines we are supposed to answer only three subparts. Kindly…
Q: The average annual rainfall at Amman airport station is 271 mm and the standard deviation is 94 mm.…
A: It is given that Mean, μ = 271 Standard deviation, σ = 94 Standardized precipitation index, SPI = (…
Q: Given that the mean of the annual maximum discharge of a river is 38 m³/sec and the standard…
A:
Q: To get an unbiased sample variance, we divide by instead of which would give us a estimate of the…
A: Introduction The variance is a measure of dispersion.
Q: Explain why a high R-squared is not an indication that an estimated OLS coefficient β^1 from a…
A: y dependent variable x1 independent variable x2 independent variable .... independent…
Q: Which of the following is unique to ratio scales (i.e., different from interval scales)? The…
A: It is possible to add, subtract, and multiply any variables measured on an interval scale but ratio…
Q: I did this question fully but only got the correct answer for 1 a). For b) I didnt get it correct…
A: The confidence interval changes when the level of confidence changes. Because by changing confidence…
Q: 6.5 Consider the population described by the probability dis- tribution shown below. The random…
A:
Q: The distribution of the amount of money spent by students for textbooks in a semester is…
A:
Q: A family has two children. What is the conditional probability that both are boys given that at…
A: We have given a family with two children Let B denote boys and G denotes girls The required sample…
Q: In which of the following circumstances are the events A and B independent? O a. P(A) = 0.35, P(B) =…
A: It is given that the two events A and B. Here, need to find out which circumstances are the events A…
Q: You are the administrator of a government agency. You have collected for a random sample of 51…
A: A random sample of 51 households of 4 people having data concerning the monthly household food…
Q: 4. A microprocessor that controls the tuner in color TVs fails completely at random (that is,…
A: Given information: The probability that a microprocessor that has survived for k years fails in…
Q: 23
A: Data given 142,156,168,174,181,178,179,179,174,178,163,167,153,145
Q: The boxplots below display annual incomes (in thousands of dollars) of households in two cities.…
A: Given Information: The box-plot representation of the annual incomes of households in two cities.
Q: The height of 10 skeletons (denoted by the variable stature) and the length of the middle metacarpal…
A: As per our guidelines I can solve only first 3 subparts of first question. Kindly post the remaining…
Q: Recently, the factory began a new production line that is more efficient than the existing…
A: The null hypothesis is the ideal value of the parameter and involves the equality sign. Alternative…
Q: How do I find the class width, the lower and upper limits. The minimum is 9 The maximum is 72…
A: We have given that Maximum value = 9 Minimum = Maximum Number of classes = 6
Q: n agenetic experiment on peas one sample of offspring contained 366 green peas and 428 yellow peas…
A: The question is about probability Given : No. of green peas = 366 No. of yellow peas = 428 To find…
Q: For the following hypothesis test, determine the null and alternative hypotheses. Also, classify the…
A: According to the given information in this question We need to answer two parts
Q: SA3535 6) The following data gives the distribution of scores of 10 students in mathematics and…
A: We have given in the question: Distribution score of 10 students.
Q: The average temperature of Hamilton in January 2020 was less than 32°F (0°C). The data is available…
A: Given information: Days Temperature 1 28 2 41 3 43 4 34 5 32 6 34 7 36 8 23 9…
Q: The table below lists the number of games played in a yearly best-of-seven baseball championship…
A: Given that: Games Played 4 5 6 7 Actual contests 18 19 24 38 Expected proportion 216 416 516…
Q: A study was conducted to find out whether people who majored in business studies did study foreign…
A:
Q: A normal distribution has a mean of µ = 54 and a standard deviation of σ = 6. What is the…
A: The question is about normal dist. Given : Popl. mean ( μ ) = 54 Popl. std. deviation ( σ ) = 6 To…
Q: What is a bar graph? What is a Pareto chart? What is a bar graph? O A. A bar graph represents the…
A: Introduction Statistics is a field which involves collection, arrangement and analysis of the data…
Q: The amount of spending rounded to the nearest thousands of dollars for education per student for a…
A: It is given that the amount of spending rounded to the nearest thousands of dollars for education…
Q: The boxplots below show the number of marshmallows in a bag, as estimated by students in two…
A: The five numerical summaries of the data sets—minimum, maximum, median, lower quartile, and higher…
Q: Q2) Paired-Samples t Test A research project has been tracking the health and cognitive functions of…
A: Given Information: The memory score for age 65 and age 75 is, Age 65 Age 75 62 65 95 88 55…
Q: 1) A bowl contains 6 berries, 2 are red, one is green, and the remaining is black in color. a) If 2…
A: The probability is the ratio of favorable outcomes of the event to the total number of outcomes. d)…
Q: Source: U.S. Census Bureau Construct a relative frequency and percentage distribution for the data.…
A: Answer:- Given, frequency table is Using formula --- Relative frequency= Subgroup Count / Total…
Q: The following sample data set list the amount of 34 families spending weekly at Costco. a) Construct…
A: Given data: Data 280 380 190 70 43 476 325 658 250 330 369 450 420…
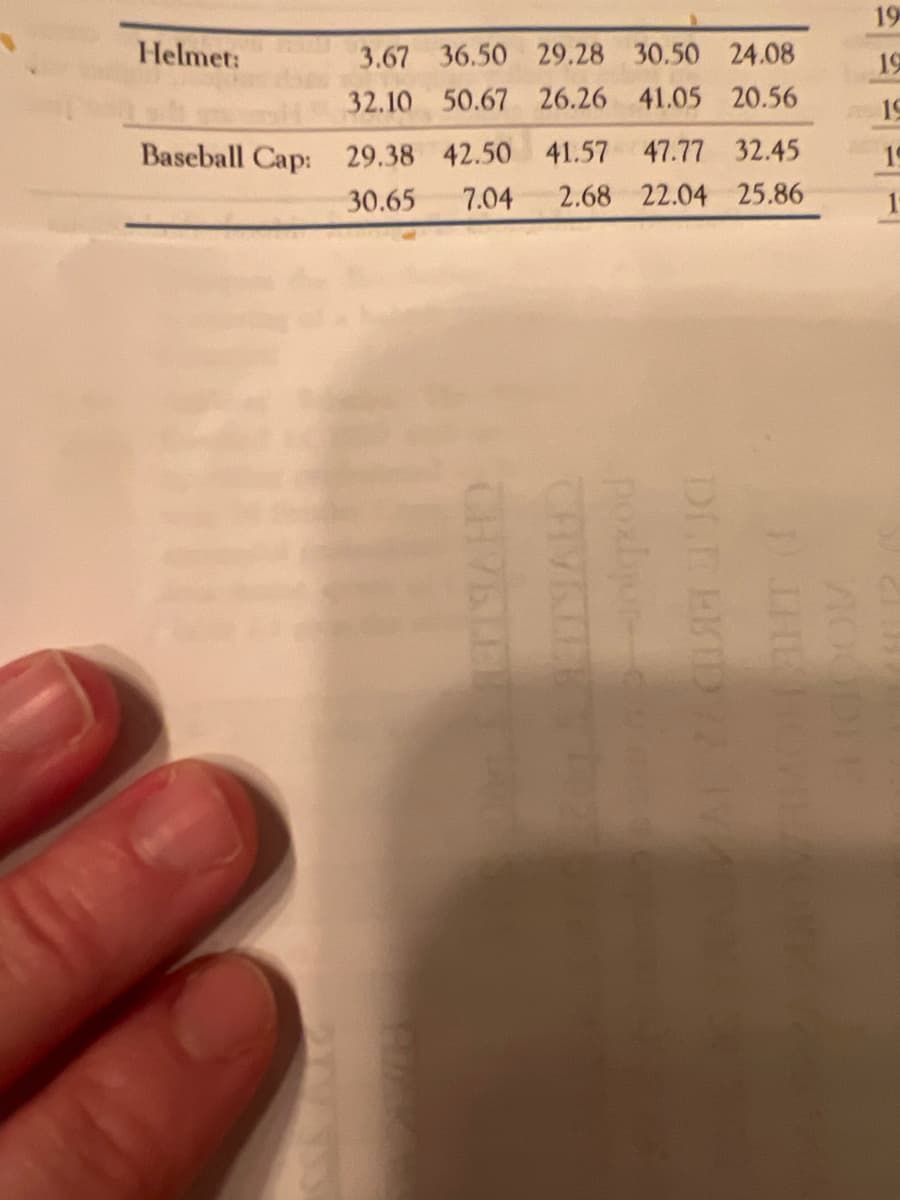
Q: 174 181 163 167 Construct a histogram for this distribution. What is the frequency for the 4th bar…
A: It is given that the ground temperature (0F) for a 6-month period in a specified location in Death…
Q: State the equation of the indifference curve which passes through (1, ) Calculate the marginal…
A: An indifference curve is a graph that shows the combinations of two goods that provide the same…
Q: Goldilocks Effect: Read to Your Kids! The American Academy of Pediatrics recommends that parents…
A: Response variable is the dependent variable which is explained by an independent (explanatory…
Q: In North Carolina, the ages of children 12 years old and under can be broken down in the following…
A: Age breakdown of children under 12 in North Carolina Frequency 8 years old 128500 9 years…
Q: Null Written There is no significant difference between the national Hoi average IQ and the IQ of…
A: From the provided information, The hypotheses are given and the claim is that Individuals in Chicago…
Q: Find the mean. Select the correct choice OA. The mean is (Type an integer or decimal round OB. The…
A: The data is given on the number of credits being taken by 13 college students. To find the measures…
Q: (b) Consider the process {Xt}, Xt=₁0€t-j where Et iid(0, 0²).
A: We have given that, εt ~iid(0, σ2)
Q: 10. Consider an analysis to compare the differences in mean CPU time to run bench- mark programs on…
A: Solution: Given information: b= 6 blocks t= 2 treatments
Q: In a business why probability is used while finding a method to advertise a product?
A: Probability is a measure of the likeliness of any event. It says about the chances of occurrence of…
Q: Let the sample space be S= {f, h, c). How many events are there?
A: Given that, The sample space is, S = {f, h,c} To find the no. of events for the sample space.
Q: With one method of a procedure called acceptance sampling, a sample of items is randomly selected…
A: Let X denotes the number of defective CDs in the sample. The ABC Electronics Company has just…
Q: Please help!! From these following topics in CANADA, choose one of the 3, and formulate a research…
A: Weather: Weather data for Hamilton January 2020 Note that I used Jamovi software for analysis.
Q: Deraty 0.6 04- 0.2 STEM Top 25%, tm 1.1 Top 5%, Im 0.9 Top 1%, fm 0.8 b Density 06- 0.4- 02- Non…
A: Given are the two graphs depicting the grades of males and females in STEM and non-STEM subjects.
Q: 1.) A fourth year adviser computes the average grades of his students and determines the top five…
A: 1)Descriptive statistics - The adviser is describing the data by computing the average grades and…
Q: particular manufacturing design requires a shaft with a diameter between 19.88 mm and 20.013 mm. The…
A: given data, normal distributionμ=20.003mmσ=0.005mmp(19.88<X<20.013)=?
Q: rn(x) = log(1 + x) - 모델 i=1 (-1)i+li 글
A:
Q: Time Period 1 2 3 4 5 6 7 8 Y₁ 200 210 215 216 219 220 225 226 200 et - Please do all calculations…
A:

Step by step
Solved in 2 steps with 1 images

- Joaquin gets paid every Friday. FI is paychecks for the past 8 Fridays were $315, $236.25, $236.25, $236.25, $315, $315, $236.25, $393.75. Find the (a) mean, (b) median, and (c) mode.Sleep apnea is a condition in which the sufferers stop breathing momentarily while they are asleep. This condition results in lack of sleep and extreme fatigue during waking hours. A current estimate is that 15 million out of the 312.7million Americans suffer from sleep apnea, or approximately 4.8%. A safety commission is concerned about the percentage of commercial truck drivers who suffer from sleep apnea. They do not have any reason to believe that it would be higher or lower than the population’s percentage. To test the claim that the percentage of commercial truck drivers who suffer from sleep apnea is not 4.8%, a simple random sample of 339 commercial truck drivers is examined by a medical expert, who concludes that 7 suffer from sleep apnea. Does this evidence support the claim that the percentage of commercial truck drivers who suffer from sleep apnea is not 4.8%? Use a 0.05 level of significance. Step 2 of 3 : Compute the value of the test statistic. Round your…Sleep apnea is a condition in which the sufferers stop breathing momentarily while they are asleep. This condition results in lack of sleep and extreme fatigue during waking hours. A current estimate is that 16.3 million out of the 312.7 million Americans suffer from sleep apnea, or approximately 5.2%. A safety commission is concerned about the percentage of commercial truck drivers who suffer from sleep apnea. They do not have any reason to believe that it would be higher or lower than the population’s percentage. To test the claim that the percentage of commercial truck drivers who suffer from sleep apnea is not 5.2%, a simple random sample of 380380 commercial truck drivers is examined by a medical expert, who concludes that 29 suffer from sleep apnea. Does this evidence support the claim that the percentage of commercial truck drivers who suffer from sleep apnea is not 5.2%? Use a 0.01 level of significance. Step 1 of 3 : State the null and alternative hypotheses for the test.…
- Sleep apnea is a condition in which the sufferers stop breathing momentarily while they are asleep. This condition results in lack of sleep and extreme fatigue during waking hours. A current estimate is that 9.7 million out of the 312.7million Americans suffer from sleep apnea, or approximately 3.1%A safety commission is concerned about the percentage of commercial truck drivers who suffer from sleep apnea. They do not have any reason to believe that it would be higher or lower than the population’s percentage. To test the claim that the percentage of commercial truck drivers who suffer from sleep apnea is not 3.1%, a simple random sample of 406commercial truck drivers is examined by a medical expert, who concludes that 55 suffer from sleep apnea. Does this evidence support the claim that the percentage of commercial truck drivers who suffer from sleep apnea is not 3.1%?Use a 0.05 level of significance. Step 3 of 3 : Draw a conclusion and interpret the decision.The highway department wants to estimate the proportion of vehicles on a Highway at KM 25 between midnight and 5:00 A.M. The head of the department wants to see how many 18-wheel tractor trailers pass on the road. These estimates will be used to determine highway repairs and construction considerations and in highway patrol planning. The department chief asked investigators to calculate estimates of vehicles at different locations on inter-island roads over the past 7 days. From 3,481 vehicles counted there are 927 are 18-wheel drive. However, out of the total 927, there were 51 vehicles that had accidents so that the sample was calculated based on the results of a reduction in the number of accidents. Specify an approximate point for the proportion of vehicles performingtravel on KM 25 during this time period which is an 18-wheeled vehicle!(Assume the confidence level is 99%). What are the benefits of estimating value estimates in this case (analysis of the answers you have obtained)?Sleep apnea is a condition in which the sufferers stop breathing momentarily while they are asleep. This condition results in lack of sleep and extreme fatigue during waking hours. A current estimate is that 12.8million out of the 312.7 million Americans suffer from sleep apnea, or approximately 4.1%. A safety commission is concerned about the percentage of commercial truck drivers who suffer from sleep apnea. They do not have any reason to believe that it would be higher or lower than the population’s percentage. To test the claim that the percentage of commercial truck drivers who suffer from sleep apnea is not 4.1%, a simple random sample of 392 commercial truck drivers is examined by a medical expert, who concludes that 24 suffer from sleep apnea. Does this evidence support the claim that the percentage of commercial truck drivers who suffer from sleep apnea is not 4.1%? Use a 0.02 level of significance. Step 1 of 3 : State the null and alternative hypotheses for the test.…
- Sleep apnea is a condition in which the sufferers stop breathing momentarily while they are asleep. This condition results in lack of sleep and extreme fatigue during waking hours. A current estimate is that 1010 million out of the 312.7312.7 million Americans suffer from sleep apnea, or approximately 3.2%3.2%. A safety commission is concerned about the percentage of commercial truck drivers who suffer from sleep apnea. They do not have any reason to believe that it would be higher or lower than the population’s percentage. To test the claim that the percentage of commercial truck drivers who suffer from sleep apnea is not 3.2%3.2%, a simple random sample of 409409 commercial truck drivers is examined by a medical expert, who concludes that 2121 suffer from sleep apnea. Does this evidence support the claim that the percentage of commercial truck drivers who suffer from sleep apnea is not 3.2%3.2%? Use a 0.050.05 level of significance. Step 2 of 3 : Compute the value of the…At the beginning of 2018, a survey showed that a country with a total land area of 500,500 square kilometers had a population density of 483.3 per square kilometer. What was the total population during the survey? A. 96, 563,436 B. 182,086,700 C. 241,891,650 D. 350, 830,401 If the birth rate was 1.3%, how many individuals were born that year? A. 2,683,450 B. 3,144,591 C. 11,320,505 D. 22,463,682 If 612,300 individuals died on the same year, what was the death rate? A. 0.25% B. 0.5% C. 1.5% D. 2%monique collects data rom a random sample of seventh gradesers in her school and finds that 10 out of 25 seventh graders participate in after school activeities write and solve a proportion to estimate the number of seventh graders n who participate in after school activeities of 190 seventh graders attened monique's school
- Sleep apnea is a condition in which the sufferers stop breathing momentarily while they are asleep. This condition results in lack of sleep and extreme fatigue during waking hours. A current estimate is that 21.321.3 million out of the 312.7312.7 million Americans suffer from sleep apnea, or approximately 6.8%6.8%. A safety commission is concerned about the percentage of commercial truck drivers who suffer from sleep apnea. They do not have any reason to believe that it would be higher or lower than the population’s percentage. To test the claim that the percentage of commercial truck drivers who suffer from sleep apnea is not 6.8%6.8%, a simple random sample of 412412 commercial truck drivers is examined by a medical expert, who concludes that 1717 suffer from sleep apnea. Does this evidence support the claim that the percentage of commercial truck drivers who suffer from sleep apnea is not 6.8%6.8%? Use a 0.050.05 level of significance. Step 4 of 4: Draw a conclusion and…Sleep apnea is a condition in which the sufferers stop breathing momentarily while they are asleep. This condition results in lack of sleep and extreme fatigue during waking hours. A current estimate is that 10.610.6 million out of the 312.7312.7 million Americans suffer from sleep apnea, or approximately 3.4%3.4%. A safety commission is concerned about the percentage of commercial truck drivers who suffer from sleep apnea. They do not have any reason to believe that it would be higher or lower than the population’s percentage. To test the claim that the percentage of commercial truck drivers who suffer from sleep apnea is not 3.4%3.4%, a simple random sample of 419419 commercial truck drivers is examined by a medical expert, who concludes that 77 suffer from sleep apnea. Does this evidence support the claim that the percentage of commercial truck drivers who suffer from sleep apnea is not 3.4%3.4%? Use a 0.100.10 level of significance. Step 2 of 3 : Compute the value of the…Leon has just received his monthly credit card statement. He placed 88 charges on his card in the last month with a mean of $20.09$20.09 per charge. He knows that 77 of the charges were as follows: $17.59,$15.23,$20.97,$14.88,$19.48,$18.91,$22.84$17.59,$15.23,$20.97,$14.88,$19.48,$18.91,$22.84 Determine the amount of the 88th charge.

