I need help with f, g and h

Big Ideas Math A Bridge To Success Algebra 1: Student Edition 2015
1st Edition
ISBN:9781680331141
Author:HOUGHTON MIFFLIN HARCOURT
Publisher:HOUGHTON MIFFLIN HARCOURT
Chapter9: Solving Quadratic Functions
Section: Chapter Questions
Problem 4CA

Related questions

Concept explainers
Transformation of Graphs
The word ‘transformation’ means modification. Transformation of the graph of a function is a process by which we modify or change the original graph and make a new graph.
Exponential Functions
The exponential function is a type of mathematical function which is used in real-world contexts. It helps to find out the exponential decay model or exponential growth model, in mathematical models. In this topic, we will understand descriptive rules, concepts, structures, graphs, interpreter series, work formulas, and examples of functions involving exponents.
Question
I need help with f, g and h
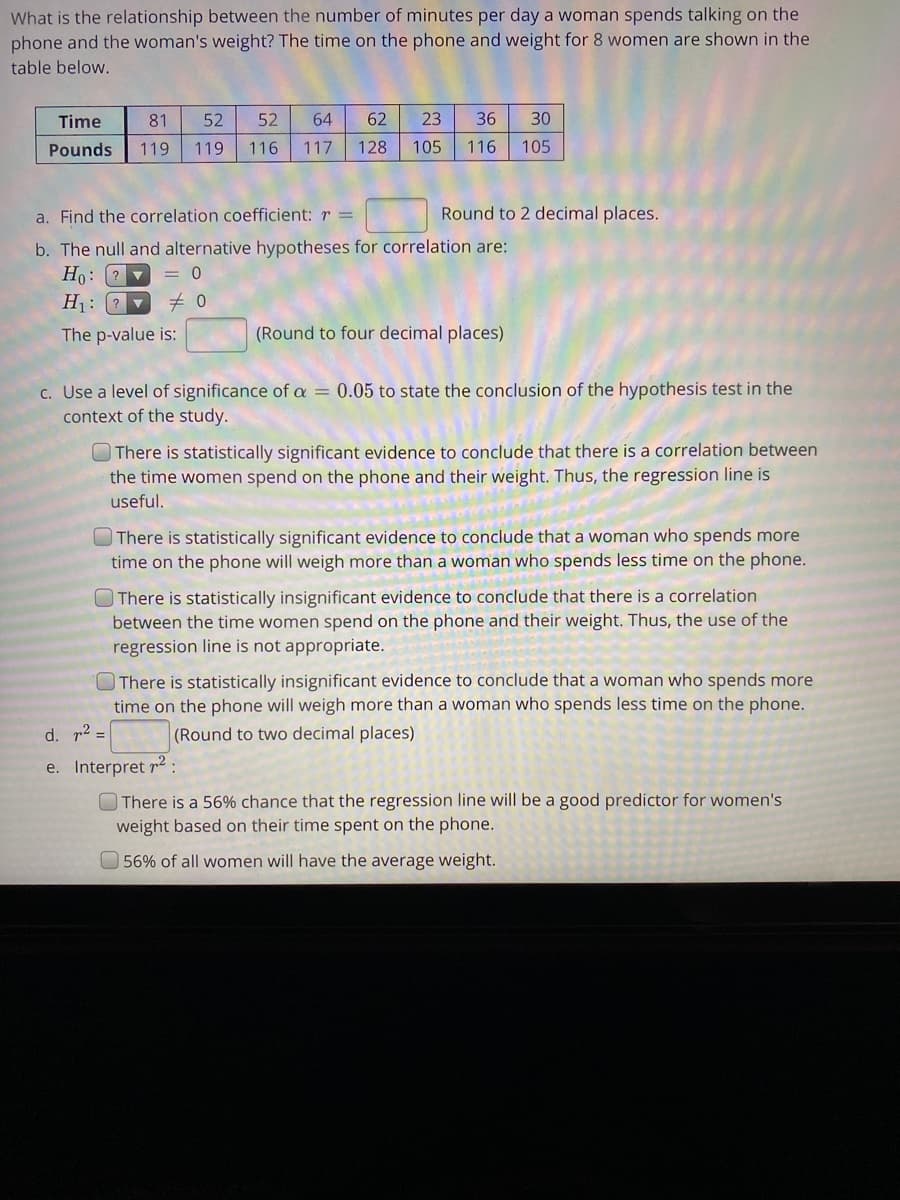
Transcribed Image Text:What is the relationship between the number of minutes per day a woman spends talking on the
phone and the woman's weight? The time on the phone and weight for 8 women are shown in the
table below.
Time
81
52
52
64
62
23
36
30
Pounds
119
119
116
117
128
105
116
105
a. Find the correlation coefficient: r =
Round to 2 decimal places.
b. The null and alternative hypotheses for correlation are:
Ho: (?
H: ?
= 0
The p-value is:
(Round to four decimal places)
c. Use a level of significance of a = 0.05 to state the conclusion of the hypothesis test in the
context of the study.
There is statistically significant evidence to conclude that there is a correlation between
the time women spend on the phone and their weight. Thus, the regression line is
useful.
There is statistically significant evidence to conclude that a woman who spends more
time on the phone will weigh more than a woman who spends less time on the phone.
O There is statistically insignificant evidence to conclude that there is a correlation
between the time women spend on the phone and their weight. Thus, the use of the
regression line is not appropriate.
There is statistically insignificant evidence to conclude that a woman who spends more
time on the phone will weigh more than a woman who spends less time on the phone.
d. r2 =
(Round to two decimal places)
e. Interpret r2 :
O There is a 56% chance that the regression line will be a good predictor for women's
weight based on their time spent on the phone.
56% of all women will have the average weight.
![O There is a large variation in women's weight, but if you only look at women with a fixed
weight, this variation on average is reduced by 56%.
O Given any group of women who all weight the same amount, 56% of all of these women
will weigh the predicted amount.
f. The equation of the linear regression line is:
=
c (Please show your answers to two decimal places)
g. Use the model to predict the weight of a woman who spends 40 minutes on the phone.
Weight =
(Please round your answer to the nearest whole number.)
h. Interpret the slope of the regression line in the context of the question:
As x goes up, y goes up.
For every additional minute women spend on the phone, they tend to weigh on averge
0.29 additional pounds.
The slope has no practical meaning since you cannot predict a women's weight.
i. Interpret the y-intercept in the context of the question:
The average woman's weight is predicted to be 101.
OIf a woman does not spend any time talking on the phone, then that woman will weigh
101 pounds.
OThe y-intercept has no practical meaning for this study.
The best prediction for the weight of a woman who does not spend any time talking on
the phone is 101 pounds.
Hint: Helpful Video on the Linear Regression Line 2 [+]
Helpful Video on Correlation (+]
Helpful Video on Hypothesis Tests for Correlation 2 [+]](/v2/_next/image?url=https%3A%2F%2Fcontent.bartleby.com%2Fqna-images%2Fquestion%2F429495fa-514f-4d6e-b279-1e2d20094f9e%2F44624c7f-03de-4f7a-828c-8bd283b613e3%2Fvw04kkh_processed.jpeg&w=3840&q=75)
Transcribed Image Text:O There is a large variation in women's weight, but if you only look at women with a fixed
weight, this variation on average is reduced by 56%.
O Given any group of women who all weight the same amount, 56% of all of these women
will weigh the predicted amount.
f. The equation of the linear regression line is:
=
c (Please show your answers to two decimal places)
g. Use the model to predict the weight of a woman who spends 40 minutes on the phone.
Weight =
(Please round your answer to the nearest whole number.)
h. Interpret the slope of the regression line in the context of the question:
As x goes up, y goes up.
For every additional minute women spend on the phone, they tend to weigh on averge
0.29 additional pounds.
The slope has no practical meaning since you cannot predict a women's weight.
i. Interpret the y-intercept in the context of the question:
The average woman's weight is predicted to be 101.
OIf a woman does not spend any time talking on the phone, then that woman will weigh
101 pounds.
OThe y-intercept has no practical meaning for this study.
The best prediction for the weight of a woman who does not spend any time talking on
the phone is 101 pounds.
Hint: Helpful Video on the Linear Regression Line 2 [+]
Helpful Video on Correlation (+]
Helpful Video on Hypothesis Tests for Correlation 2 [+]
Expert Solution
This question has been solved!
Explore an expertly crafted, step-by-step solution for a thorough understanding of key concepts.

Step by step
Solved in 2 steps with 4 images

Knowledge Booster


Learn more about
Need a deep-dive on the concept behind this application? Look no further. Learn more about this topic, statistics and related others by exploring similar questions and additional content below.Recommended textbooks for you
Big Ideas Math A Bridge To Success Algebra 1: Stu…
Algebra
ISBN:
9781680331141
Author:
HOUGHTON MIFFLIN HARCOURT
Publisher:
Houghton Mifflin Harcourt

Glencoe Algebra 1, Student Edition, 9780079039897…
Algebra
ISBN:
9780079039897
Author:
Carter
Publisher:
McGraw Hill
Big Ideas Math A Bridge To Success Algebra 1: Stu…
Algebra
ISBN:
9781680331141
Author:
HOUGHTON MIFFLIN HARCOURT
Publisher:
Houghton Mifflin Harcourt
Glencoe Algebra 1, Student Edition, 9780079039897…
Algebra
ISBN:
9780079039897
Author:
Carter
Publisher:
McGraw Hill