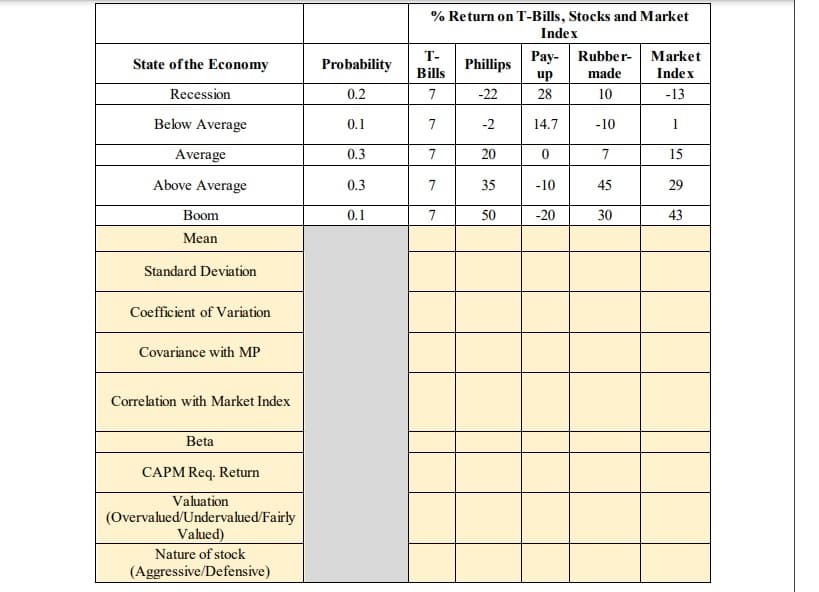
Fill the parts in the above table that are shaded in yellow. You will notice that there are nine line items. Using the data generated in the previous question (Question 1); a) Plot the Security Market Line (SML) b) Superimpose the CAPM’s required return on the SML c) Indicate which investments will plot on, above and below the SML? d) If an investment’s expected return (mean return) does not plot on the SML, what does it show? Identify undervalued/overvalued investments from the graph Please answer A, B, C & D
Fill the parts in the above table that are shaded in yellow. You will notice that there are nine line items. Using the data generated in the previous question (Question 1); a) Plot the Security Market Line (SML) b) Superimpose the CAPM’s required return on the SML c) Indicate which investments will plot on, above and below the SML? d) If an investment’s expected return (mean return) does not plot on the SML, what does it show? Identify undervalued/overvalued investments from the graph Please answer A, B, C & D
Intermediate Financial Management (MindTap Course List)
13th Edition
ISBN:9781337395083
Author:Eugene F. Brigham, Phillip R. Daves
Publisher:Eugene F. Brigham, Phillip R. Daves
Chapter2: Risk And Return: Part I
Section: Chapter Questions
Problem 12MC
Related questions
Question
Fill the parts in the above table that are shaded in yellow. You will notice that there are nine
line items.
Using the data generated in the previous question (Question 1);
a) Plot the Security Market Line (SML)
b) Superimpose the
c) Indicate which investments will plot on, above and below the SML?
d) If an investment’s expected return (mean return) does not plot on the SML, what does
it show? Identify undervalued/overvalued investments from the graph
Please answer A, B, C & D

Transcribed Image Text:State of the Economy
Recession
Below Average
Average
Above Average
Boom
Mean
Standard Deviation
Coefficient of Variation
Covariance with MP
Correlation with Market Index
Beta
CAPM Req. Return
Valuation
(Overvalued/Undervalued/Fairly
Valued)
Nature of stock
(Aggressive/Defensive)
Probability
0.2
0.1
0.3
0.3
0.1
% Return on T-Bills, Stocks and Market
Index
T-
Bills
7
7
7
7
7
Phillips
-22
-2
20
35
50
Pay- Rubber-
made
10
-10
7
45
30
up
28
14.7
0
-10
-20
Market
Index
-13
1
15
29
43
Expert Solution
This question has been solved!
Explore an expertly crafted, step-by-step solution for a thorough understanding of key concepts.
Step by step
Solved in 5 steps with 11 images

Follow-up Questions
Read through expert solutions to related follow-up questions below.
Follow-up Question
I need help with plotting the said graph. What program was used to do the above or can a different graph style be given?
Solution
Knowledge Booster
Learn more about
Need a deep-dive on the concept behind this application? Look no further. Learn more about this topic, finance and related others by exploring similar questions and additional content below.Recommended textbooks for you

Intermediate Financial Management (MindTap Course…
Finance
ISBN:
9781337395083
Author:
Eugene F. Brigham, Phillip R. Daves
Publisher:
Cengage Learning


Financial Reporting, Financial Statement Analysis…
Finance
ISBN:
9781285190907
Author:
James M. Wahlen, Stephen P. Baginski, Mark Bradshaw
Publisher:
Cengage Learning

Intermediate Financial Management (MindTap Course…
Finance
ISBN:
9781337395083
Author:
Eugene F. Brigham, Phillip R. Daves
Publisher:
Cengage Learning


Financial Reporting, Financial Statement Analysis…
Finance
ISBN:
9781285190907
Author:
James M. Wahlen, Stephen P. Baginski, Mark Bradshaw
Publisher:
Cengage Learning