I need the answer as soon as possible Q4/ The ideal gas equation of states is given by: PV = nRT Where: P is the pressure, V is the volume, T is the temperature, R=0.08206 (L atm)/(mol K) is the ideal gas constant, and n is the number of moles. Real gases, especially at high pressures, deviate from this behavior. Their responses can be modeled with the van der Waals equation: nRT using matlab V-nb + n²a v²=0 Where a and b are gas constants. For Cl₂ a = 6.579 L'atm/mol², and b=0.0562 L/mol. (a) Write a code which asks the user to insert n, T. a, b and then plots P versus V on one figure - two plots for both equations if the volume range is (0.5
I need the answer as soon as possible Q4/ The ideal gas equation of states is given by: PV = nRT Where: P is the pressure, V is the volume, T is the temperature, R=0.08206 (L atm)/(mol K) is the ideal gas constant, and n is the number of moles. Real gases, especially at high pressures, deviate from this behavior. Their responses can be modeled with the van der Waals equation: nRT using matlab V-nb + n²a v²=0 Where a and b are gas constants. For Cl₂ a = 6.579 L'atm/mol², and b=0.0562 L/mol. (a) Write a code which asks the user to insert n, T. a, b and then plots P versus V on one figure - two plots for both equations if the volume range is (0.5

Operations Research : Applications and Algorithms
4th Edition
ISBN:9780534380588
Author:Wayne L. Winston
Publisher:Wayne L. Winston
Chapter13: Decision Making Under Uncertainty
Section13.2: Utility Theory
Problem 12P

Related questions

Question
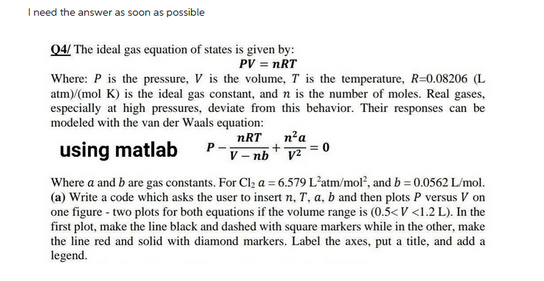
Transcribed Image Text:I need the answer as soon as possible
Q4/ The ideal gas equation of states is given by:
PV = nRT
Where: P is the pressure, V is the volume, T is the temperature, R=0.08206 (L
atm)/(mol K) is the ideal gas constant, and n is the number of moles. Real gases,
especially at high pressures, deviate from this behavior. Their responses can be
modeled with the van der Waals equation:
nRT
using matlab
V-nb
+
n² a
V²
Where a and b are gas constants. For Cl₂ a = 6.579 L'atm/mol², and b = 0.0562 L/mol.
(a) Write a code which asks the user to insert n, T, a, b and then plots P versus V on
one figure - two plots for both equations if the volume range is (0.5<V <1.2 L). In the
first plot, make the line black and dashed with square markers while in the other, make
the line red and solid with diamond markers. Label the axes, put a title, and add a
legend.
Expert Solution
This question has been solved!
Explore an expertly crafted, step-by-step solution for a thorough understanding of key concepts.

Step by step
Solved in 3 steps with 2 images

Knowledge Booster


Learn more about
Need a deep-dive on the concept behind this application? Look no further. Learn more about this topic, computer-science and related others by exploring similar questions and additional content below.Recommended textbooks for you
Operations Research : Applications and Algorithms
Computer Science
ISBN:
9780534380588
Author:
Wayne L. Winston
Publisher:
Brooks Cole
Operations Research : Applications and Algorithms
Computer Science
ISBN:
9780534380588
Author:
Wayne L. Winston
Publisher:
Brooks Cole