(i) Plot the species distribution diagram for chloro complexation of lead (Pb) based on the log of the overall formation constants. * log(Bn) 0.9 log(Bra) 1.3 log(Brs) 1.5
(i) Plot the species distribution diagram for chloro complexation of lead (Pb) based on the log of the overall formation constants. * log(Bn) 0.9 log(Bra) 1.3 log(Brs) 1.5

Chapter9: Complexometric And Precipitation Titrations
Section: Chapter Questions
Problem 9P

Related questions

Question
3
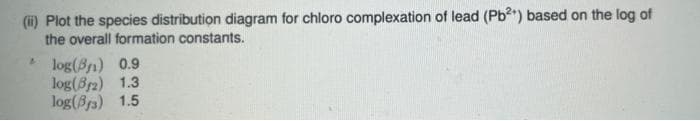
Transcribed Image Text:(i) Plot the species distribution diagram for chloro complexation of lead (Pb) based on the log of
the overall formation constants.
* log(8n) 0.9
log(8r2) 1.3
log(Br3) 1.5
Expert Solution
This question has been solved!
Explore an expertly crafted, step-by-step solution for a thorough understanding of key concepts.

Step by step
Solved in 2 steps with 2 images

Knowledge Booster


Learn more about
Need a deep-dive on the concept behind this application? Look no further. Learn more about this topic, chemistry and related others by exploring similar questions and additional content below.Recommended textbooks for you