i want to explain and answer Initial State(node): This state requires an initial state for the problem which starts the AI agent towards a specified goal. ● Transition: It’s required to show the cost between every 2 nodes. Each team should define the cost metrics for each path (for example: distance, crowd, … etc.) ● Goal test: This stage determines that the specified goal achieved by the integrated transition model or not, whenever the goal achieves stop the action and forward into the next stage to determines the cost to achieve the goal.
i want to explain and answer Initial State(node): This state requires an initial state for the problem which starts the AI agent towards a specified goal. ● Transition: It’s required to show the cost between every 2 nodes. Each team should define the cost metrics for each path (for example: distance, crowd, … etc.) ● Goal test: This stage determines that the specified goal achieved by the integrated transition model or not, whenever the goal achieves stop the action and forward into the next stage to determines the cost to achieve the goal.
Chapter10: Building Successful Information Systems
Section: Chapter Questions
Problem 1P

Related questions
Question
i want to explain and answer
Initial State(node): This state requires an initial state for the problem which starts the
towards a specified goal.
● Transition: It’s required to show the cost between every 2 nodes. Each team should define the
cost metrics for each path (for example: distance, crowd, … etc.)
● Goal test: This stage determines that the specified goal achieved by the integrated transition
model or not, whenever the goal achieves stop the action and forward into the next stage to
determines the cost to achieve the goal.
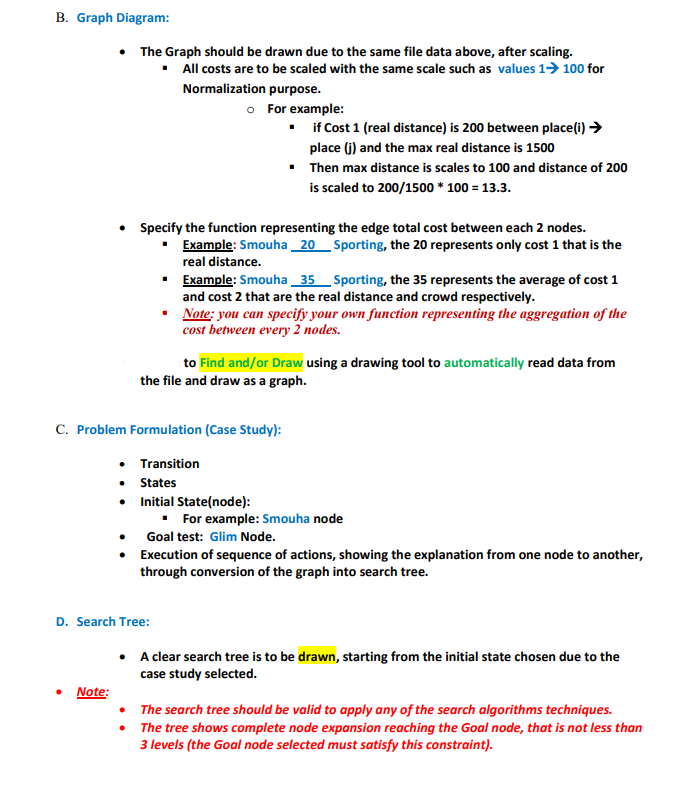
Transcribed Image Text:B. Graph Diagram:
• The Graph should be drawn due to the same file data above, after scaling.
■ All costs are to be scaled with the same scale such as values 1→ 100 for
Normalization purpose.
o For example:
▪if Cost 1 (real distance) is 200 between place (i) →
place (j) and the max real distance is 1500
▪ Then max distance is scales to 100 and distance of 200
is scaled to 200/1500 * 100 = 13.3.
• Specify the function representing the edge total cost between each 2 nodes.
▪ Example: Smouha_20
Sporting, the 20 represents only cost 1 that is the
real distance.
▪
Example: Smouha 35 Sporting, the 35 represents the average of cost 1
and cost 2 that are the real distance and crowd respectively.
▪
Note: you can specify your own function representing the aggregation of the
cost between every 2 nodes.
to Find and/or Draw using a drawing tool to automatically read data from
the file and draw as a graph.
C. Problem Formulation (Case Study):
Transition
•
States
•
Initial State(node):
▪ For example: Smouha node
Goal test: Glim Node.
Execution of sequence of actions, showing the explanation from one node to another,
through conversion of the graph into search tree.
D. Search Tree:
• A clear search tree is to be drawn, starting from the initial state chosen due to the
case study selected.
●
Note:
• The search tree should be valid to apply any of the search algorithms techniques.
The tree shows complete node expansion reaching the Goal node, that is not less than
3 levels (the Goal node selected must satisfy this constraint).
•
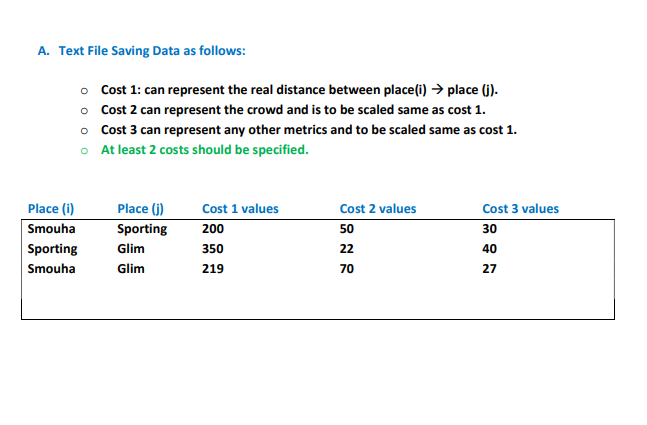
Transcribed Image Text:A. Text File Saving Data as follows:
Place (i)
Smouha
Sporting
Smouha
o Cost 1: can represent the real distance between place(i) → place (j).
o Cost 2 can represent the crowd and is to be scaled same as cost 1.
o Cost 3 can represent any other metrics and to be scaled same as cost 1.
At least 2 costs should be specified.
o
Place (j)
Cost 1 values
Cost 2 values
Cost 3 values
Sporting
200
50
30
Glim
350
22
40
Glim
219
70
27
Expert Solution
This question has been solved!
Explore an expertly crafted, step-by-step solution for a thorough understanding of key concepts.

Step by step
Solved in 2 steps

Knowledge Booster


Learn more about
Need a deep-dive on the concept behind this application? Look no further. Learn more about this topic, computer-science and related others by exploring similar questions and additional content below.Recommended textbooks for you

Operations Research : Applications and Algorithms
Computer Science
ISBN:
9780534380588
Author:
Wayne L. Winston
Publisher:
Brooks Cole
Operations Research : Applications and Algorithms
Computer Science
ISBN:
9780534380588
Author:
Wayne L. Winston
Publisher:
Brooks Cole