(i) what would be the growth of the plant if 4g of fertilizer and 7g of water was given to it daily (ii) carry out an f test at the 1% significance level to determine whether the model is significant
(i) what would be the growth of the plant if 4g of fertilizer and 7g of water was given to it daily (ii) carry out an f test at the 1% significance level to determine whether the model is significant

Algebra & Trigonometry with Analytic Geometry
13th Edition
ISBN:9781133382119
Author:Swokowski
Publisher:Swokowski
Chapter7: Analytic Trigonometry
Section7.6: The Inverse Trigonometric Functions
Problem 94E

Related questions
Question
(i) what would be the growth of the plant if 4g of fertilizer and 7g of water was given to it daily
(ii) carry out an f test at the 1% significance level to determine whether the model is significant
Transcribed Image Text:6:15
ll LTE
Done
Retake
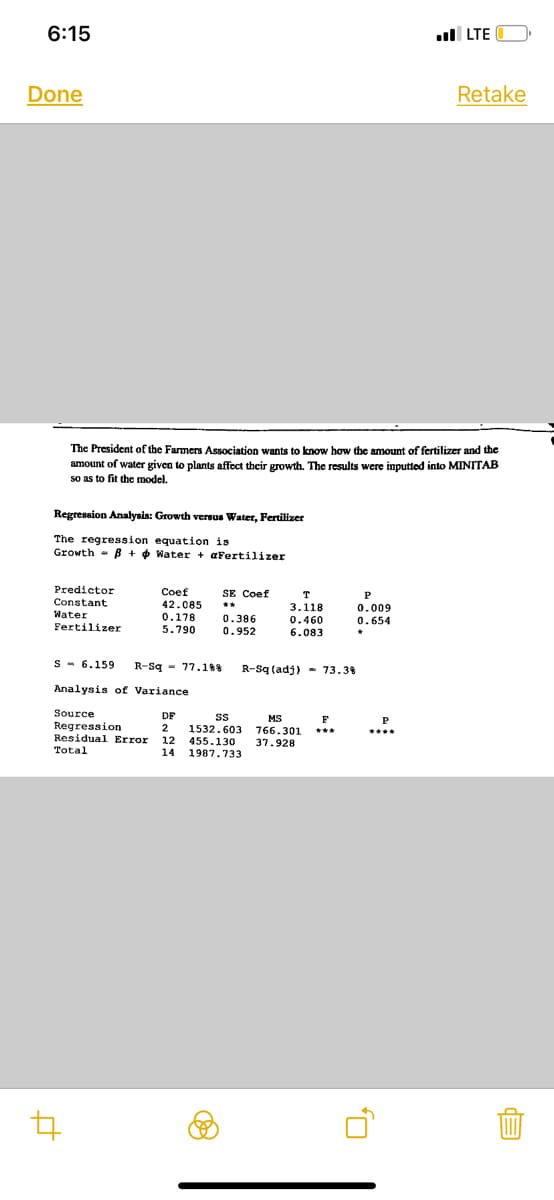
The President of the Farmers ASsociation wants to know how the amount of fertilizer and the
amount of water given to plants affect their growth. The results were inputted into MINITAB
so as to fit the model.
Regression Analysis: Growth versus Water, Fertilizer
The regression equation is
Growth - B + + Water + aFertilizer
Predictor
Constant
Coef
42.085
0.178
5.790
SE Coef
T
P
**
3.118
0.009
0.654
Water
0.386
0.952
0.460
6.083
Fertilizer
S - 6.159
R-Sq - 77.188
R-Sq (adj) - 73.3%
Analysis of Variance
Source
Regression
Residual Error
Total
DF
MS
F
P
2
12
14 1987,733
1532.603 766.301
455.130
***
****
37.928
Expert Solution
This question has been solved!
Explore an expertly crafted, step-by-step solution for a thorough understanding of key concepts.

Step by step
Solved in 2 steps with 1 images

Recommended textbooks for you
Algebra & Trigonometry with Analytic Geometry
Algebra
ISBN:
9781133382119
Author:
Swokowski
Publisher:
Cengage

Functions and Change: A Modeling Approach to Coll…
Algebra
ISBN:
9781337111348
Author:
Bruce Crauder, Benny Evans, Alan Noell
Publisher:
Cengage Learning

College Algebra
Algebra
ISBN:
9781305115545
Author:
James Stewart, Lothar Redlin, Saleem Watson
Publisher:
Cengage Learning
Algebra & Trigonometry with Analytic Geometry
Algebra
ISBN:
9781133382119
Author:
Swokowski
Publisher:
Cengage
Functions and Change: A Modeling Approach to Coll…
Algebra
ISBN:
9781337111348
Author:
Bruce Crauder, Benny Evans, Alan Noell
Publisher:
Cengage Learning
College Algebra
Algebra
ISBN:
9781305115545
Author:
James Stewart, Lothar Redlin, Saleem Watson
Publisher:
Cengage Learning

Algebra and Trigonometry (MindTap Course List)
Algebra
ISBN:
9781305071742
Author:
James Stewart, Lothar Redlin, Saleem Watson
Publisher:
Cengage Learning