I. Construct the scatter plot of the given table using MS Excel or manually draw a scatter plot. Identify the type of association. Attached the paper the contains the scatter plot in this activity sheet. 1. The table below shows the number of hours of study of 6 students and their corresponding grades Hours of Study (X) Grade (V) 6 82 A B C D E Student A B C D E a. n b. ΣX= © 2Y = d. ΣXY = c. EX² = f. ΣY² = II. Compute the value of the correlation coefficient for the data obtained in the study of the number of hours of study of 6 students and their corresponding grades. 1. Compute the table below. X 2. Find the values of the following: 2 1 5 2 3 63 57 88 68 75 XY product moment correlation coefficient or Pearson r.
I. Construct the scatter plot of the given table using MS Excel or manually draw a scatter plot. Identify the type of association. Attached the paper the contains the scatter plot in this activity sheet. 1. The table below shows the number of hours of study of 6 students and their corresponding grades Hours of Study (X) Grade (V) 6 82 A B C D E Student A B C D E a. n b. ΣX= © 2Y = d. ΣXY = c. EX² = f. ΣY² = II. Compute the value of the correlation coefficient for the data obtained in the study of the number of hours of study of 6 students and their corresponding grades. 1. Compute the table below. X 2. Find the values of the following: 2 1 5 2 3 63 57 88 68 75 XY product moment correlation coefficient or Pearson r.

Glencoe Algebra 1, Student Edition, 9780079039897, 0079039898, 2018
18th Edition
ISBN:9780079039897
Author:Carter
Publisher:Carter
Chapter4: Equations Of Linear Functions
Section4.5: Correlation And Causation
Problem 11PPS

Related questions
Question
Please answer the subparts.
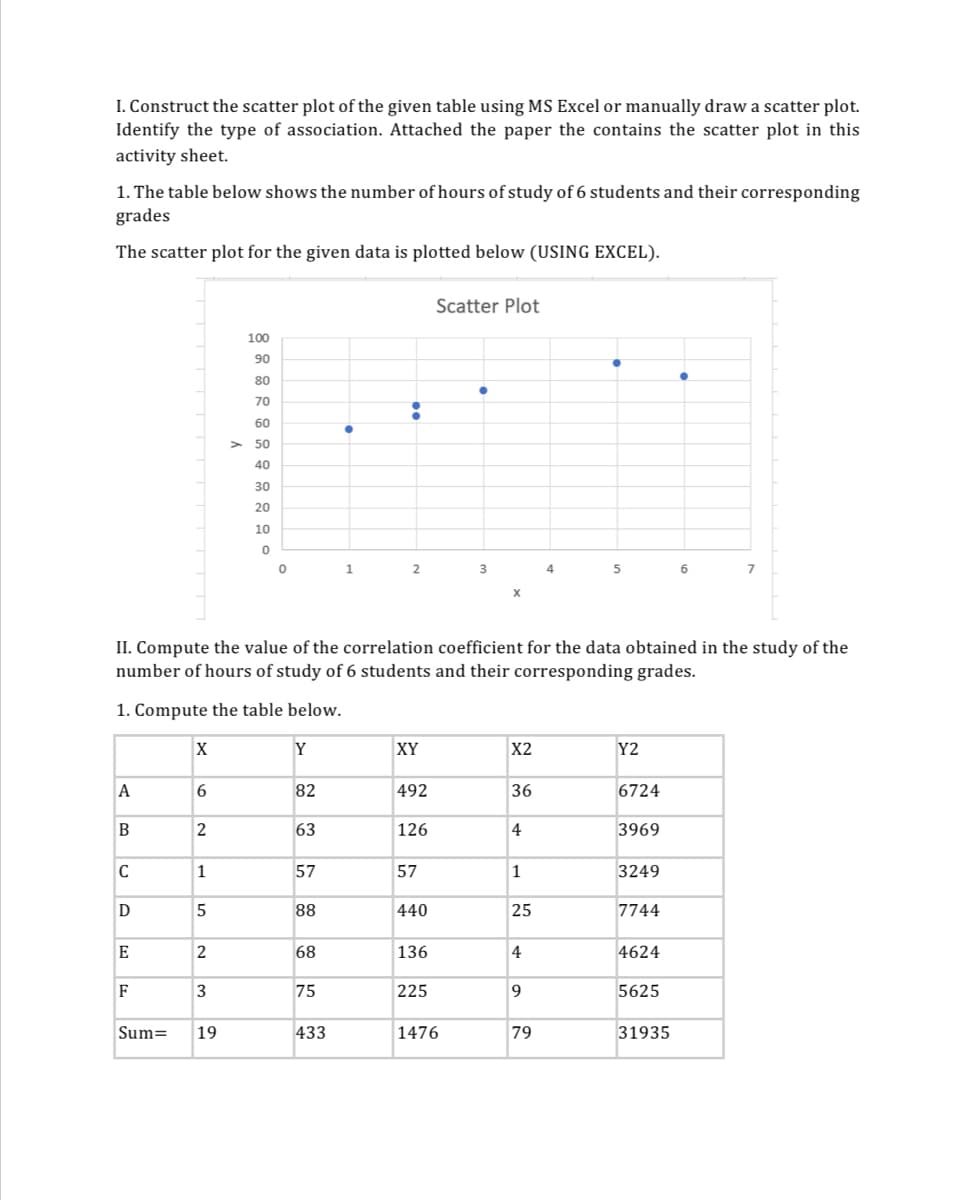
Transcribed Image Text:I. Construct the scatter plot of the given table using MS Excel or manually draw a scatter plot.
Identify the type of association. Attached the paper the contains the scatter plot in this
activity sheet.
1. The table below shows the number of hours of study of 6 students and their corresponding
grades
The scatter plot for the given data is plotted below (USING EXCEL).
A
B
C
D
E
F
Sum=
X
6
2
1
5
2
3
100
90
80
70
60
> 50
40
30
20
10
0
II. Compute the value of the correlation coefficient for the data obtained in the study of the
number of hours of study of 6 students and their corresponding grades.
1. Compute the table below.
19
0
Y
82
63
57
88
68
75
●
433
1
2
XY
492
126
57
440
136
Scatter Plot
225
3
1476
X2
36
4
1
25
4
9
4
79
●
5
Y2
6724
3969
3249
7744
4624
5625
6
31935
7
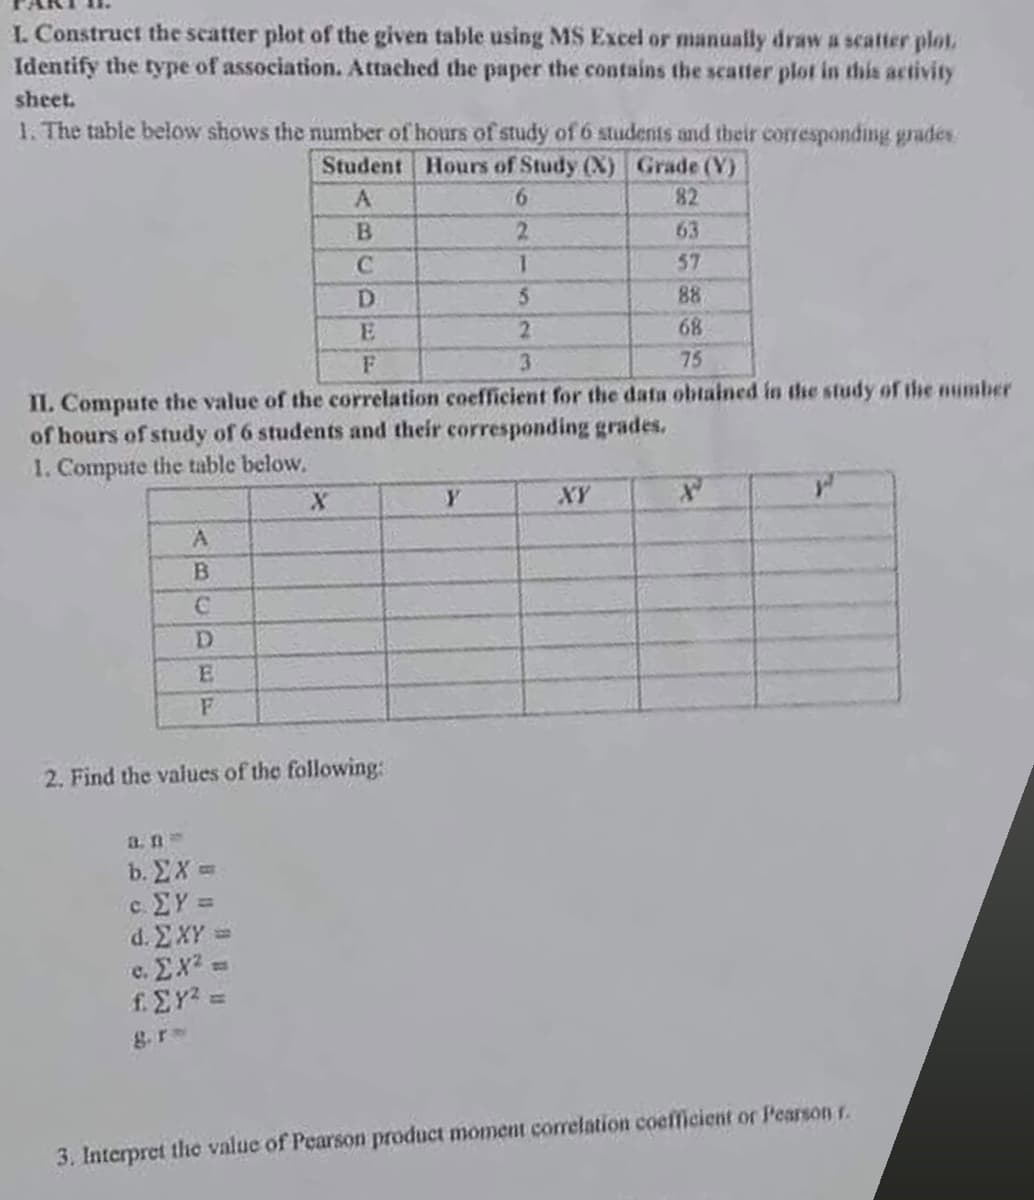
Transcribed Image Text:I. Construct the scatter plot of the given table using MS Excel or manually draw a scatter plot.
Identify the type of association. Attached the paper the contains the scatter plot in this activity
sheet.
1. The table below shows the number of hours of study of 6 students and their corresponding grades
Student Hours of Study (X) Grade (V)
A
6
82
B
C
D
A
B
C
D
E
F
II. Compute the value of the correlation coefficient for the data obtained in the study of the number
of hours of study of 6 students and their corresponding grades.
1. Compute the table below.
X
2. Find the values of the following:
a. n
b. ΣX=
c. ΣY =
d. ΣXY =
c. EX² =
f. ΣY² ==
2
1
5
2
3
63
57
88
68
75
XY
3. Interpret the value of Pearson product moment correlation coefficient or Pearson r.
Expert Solution
This question has been solved!
Explore an expertly crafted, step-by-step solution for a thorough understanding of key concepts.

This is a popular solution!

Trending now
This is a popular solution!

Step by step
Solved in 2 steps with 2 images

Recommended textbooks for you
Glencoe Algebra 1, Student Edition, 9780079039897…
Algebra
ISBN:
9780079039897
Author:
Carter
Publisher:
McGraw Hill

Holt Mcdougal Larson Pre-algebra: Student Edition…
Algebra
ISBN:
9780547587776
Author:
HOLT MCDOUGAL
Publisher:
HOLT MCDOUGAL
Glencoe Algebra 1, Student Edition, 9780079039897…
Algebra
ISBN:
9780079039897
Author:
Carter
Publisher:
McGraw Hill
Holt Mcdougal Larson Pre-algebra: Student Edition…
Algebra
ISBN:
9780547587776
Author:
HOLT MCDOUGAL
Publisher:
HOLT MCDOUGAL