IBM is interested in comparing the average project completion time using last year's software versus using the new software. So, a consultant for IBM randomly selected 36 projects using last year's software and 36 projects using the new software. The completion time (in hours) for each project was recorded and then entered into Excel. Can IBM conclude the average project completion time using the new softwarejs greater than the average project completion time using last year's software at a=.005? Based on this paragraph of text, use the correct excel output above to ahswer the following question. For the hypothesis stated above, what is the decision (in terms of "New" minus "Last Year")? O a. Reject Ho because p-value < a. O b. Fail to reject Ho because p-value < a. O C. Reject Ho because p-value > a. O d. Fail to reject Ho because p-value > a. O e. None of the answers is correct
IBM is interested in comparing the average project completion time using last year's software versus using the new software. So, a consultant for IBM randomly selected 36 projects using last year's software and 36 projects using the new software. The completion time (in hours) for each project was recorded and then entered into Excel. Can IBM conclude the average project completion time using the new softwarejs greater than the average project completion time using last year's software at a=.005? Based on this paragraph of text, use the correct excel output above to ahswer the following question. For the hypothesis stated above, what is the decision (in terms of "New" minus "Last Year")? O a. Reject Ho because p-value < a. O b. Fail to reject Ho because p-value < a. O C. Reject Ho because p-value > a. O d. Fail to reject Ho because p-value > a. O e. None of the answers is correct

MATLAB: An Introduction with Applications
6th Edition
ISBN:9781119256830
Author:Amos Gilat
Publisher:Amos Gilat
Chapter1: Starting With Matlab
Section: Chapter Questions
Problem 1P

Related questions

Topic Video
Question
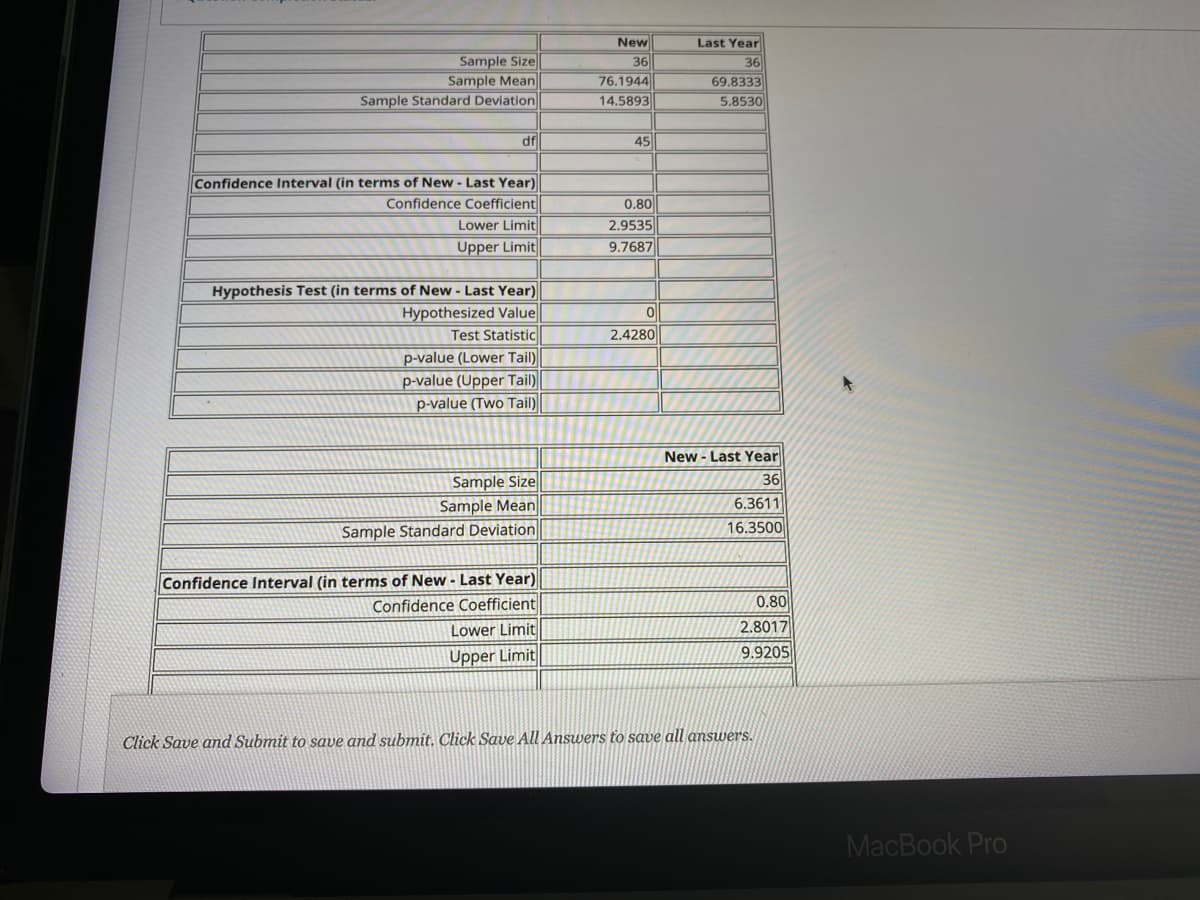
Transcribed Image Text:New
36
76.1944
Last Year
Sample Size
Sample Mean
Sample Standard Deviation
36
69.8333
14,5893
5.8530
df
45
Confidence lInterval (in terms of New - Last Year)
Confidence Coefficient
Lower Limit
0.80
2.9535
9.7687
Upper Limit
Hypothesis Test (in terms of New - Last Year)
Hypothesized Value
Test Statistic
2.4280
p-value (Lower Tail)
p-value (Upper Tail)
p-value (Two Tail)
New - Last Year
Sample Size
Sample Mean
Sample Standard Deviation
36
6.3611
16.3500
Confidence Interval (in terms of New - Last Year)
Confidence Coefficient
Lower Limit
0.80
2.8017
9.9205
Upper Limit
Click Save and Submit to save and submit. Click Save All Answers to save all answers.
MacBook Pro
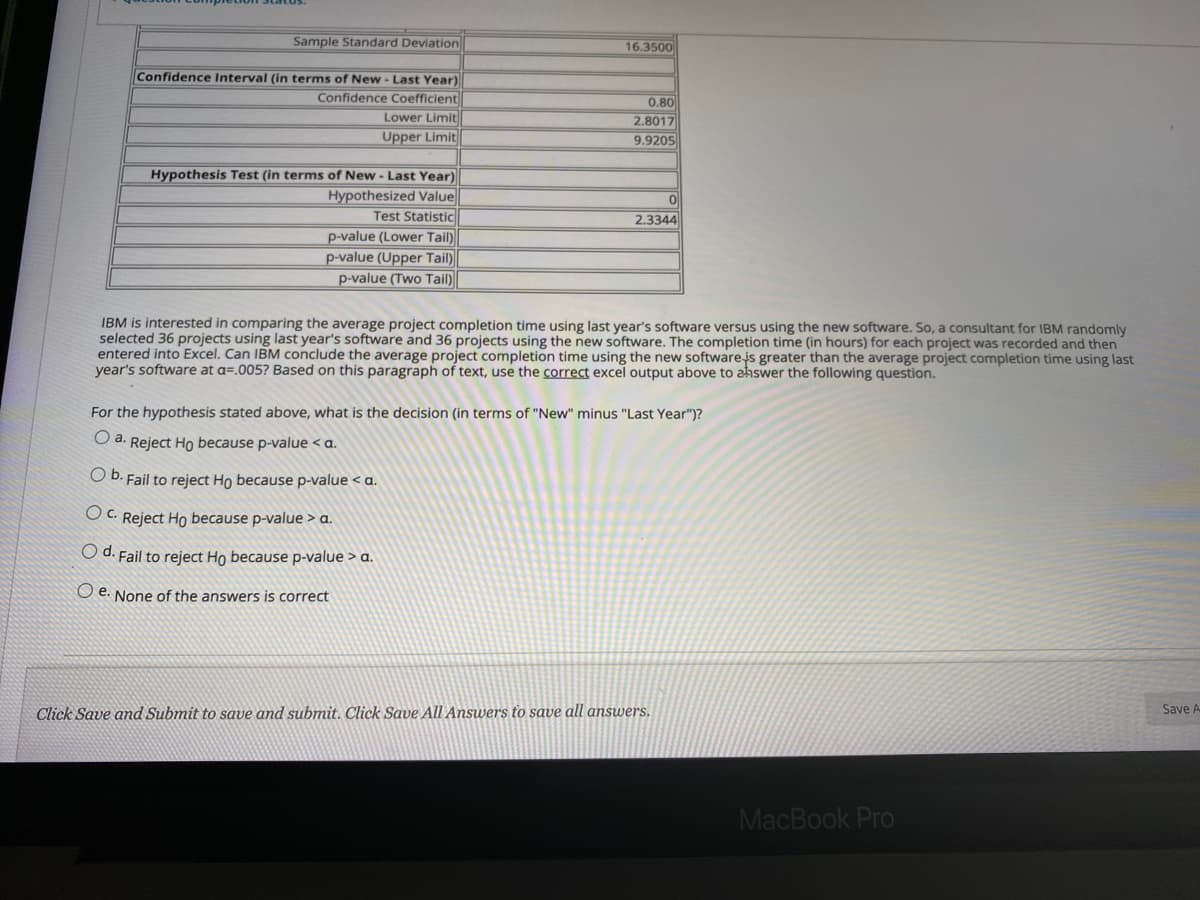
Transcribed Image Text:Sample Standard Deviation
16.3500
Confidence Interval (in terms of New - Last Year)
Confidence Coefficient
Lower Limit
0.80
2.8017
9.9205
Upper Limit
Hypothesis Test (in terms of New - Last Year)
Hypothesized Value
Test Statistic
p-value (Lower Tail)
p-value (Upper Tail)
p-value (Two Tail)
2.3344
IBM is interested in comparing the average project completion time using last year's software versus using the new software. So, a consultant for IBM randomly
selected 36 projects using last year's software and 36 projects using the new software. The completion time (in hours) for each project was recorded and then
entered into Excel. Can IBM conclude the average project completion time using the new softwarejs greater than the average project completion time using last
year's software at a=.005? Based on this paragraph of text, use the correct excel output above to ahswer the following question.
For the hypothesis stated above, what is the decision (in terms of "New" minus "Last Year")?
O a. Reject Ho because p-value < a.
O D. Fail to reject Ho because p-value < a.
O C. Reject Ho because p-value > a.
O d. Fail to reject Ho because p-value > a.
O e. None of the answers is correct
Click Save and Submit to save and submit. Click Save All Answers to save all answers.
Save A
MacBook Pro
Expert Solution
This question has been solved!
Explore an expertly crafted, step-by-step solution for a thorough understanding of key concepts.

This is a popular solution!

Trending now
This is a popular solution!

Step by step
Solved in 3 steps with 2 images

Knowledge Booster


Learn more about
Need a deep-dive on the concept behind this application? Look no further. Learn more about this topic, statistics and related others by exploring similar questions and additional content below.Recommended textbooks for you
MATLAB: An Introduction with Applications
Statistics
ISBN:
9781119256830
Author:
Amos Gilat
Publisher:
John Wiley & Sons Inc

Probability and Statistics for Engineering and th…
Statistics
ISBN:
9781305251809
Author:
Jay L. Devore
Publisher:
Cengage Learning

Statistics for The Behavioral Sciences (MindTap C…
Statistics
ISBN:
9781305504912
Author:
Frederick J Gravetter, Larry B. Wallnau
Publisher:
Cengage Learning
MATLAB: An Introduction with Applications
Statistics
ISBN:
9781119256830
Author:
Amos Gilat
Publisher:
John Wiley & Sons Inc
Probability and Statistics for Engineering and th…
Statistics
ISBN:
9781305251809
Author:
Jay L. Devore
Publisher:
Cengage Learning
Statistics for The Behavioral Sciences (MindTap C…
Statistics
ISBN:
9781305504912
Author:
Frederick J Gravetter, Larry B. Wallnau
Publisher:
Cengage Learning

Elementary Statistics: Picturing the World (7th E…
Statistics
ISBN:
9780134683416
Author:
Ron Larson, Betsy Farber
Publisher:
PEARSON

The Basic Practice of Statistics
Statistics
ISBN:
9781319042578
Author:
David S. Moore, William I. Notz, Michael A. Fligner
Publisher:
W. H. Freeman

Introduction to the Practice of Statistics
Statistics
ISBN:
9781319013387
Author:
David S. Moore, George P. McCabe, Bruce A. Craig
Publisher:
W. H. Freeman