Identify the cumulative frequency distribution corresponds for the given frequency distribution


Q: Based on the histogram, draw the ogive (the cumulative frequency polygon) for the data from the…
A: The cumulative frequency is, Daily Methadone dosage Frequency Cumulative frequency 0 - 49 3 3…
Q: Please create a group frequency distribution using 5 classes. For relative frequency column, round…
A: The data for unclaimed expired prizes is: 28.5 51.7 19 5 2 1.2 14 14.6 0.8…
Q: The following table summarizes the ages of a sample of 58 adults that are members of a certain…
A: Given, 58 ages of adults samples Freq. distribution table is Age Frequency 20-24 1 25-29 3…
Q: The following frequency distribution table represents data on age of 28 randomly selected customers…
A: The table helps to find the mean. Class interval Mid point, m frequency, f fm 10-20 15 5 75…
Q: Among fatal plane crashes that occurred during the past 50 years, 490 were due to pilot error, 77…
A:
Q: Take 50 observations at random ranged from (117- 254). Make a grouped frequency distribution. Find…
A: We need to take a 50 observations at random ranged from (117-254). For this we can use…
Q: In a grouped frequency distribution, a cumulative percentage of 80% corresponds to the interval 5-9.…
A: The kth percentile can be interpreted as, value at or below which at least k percent of the…
Q: Take 50 observations at random ranged from (117- 254). Make a grouped frequency distribution. Find…
A: We draw a 50 random numbers between 117 to 254 using command #RANDBETWEEN() in excel. 195 158…
Q: Construct a cumulative frequency distribution corresponds to the given frequency distribution.…
A:
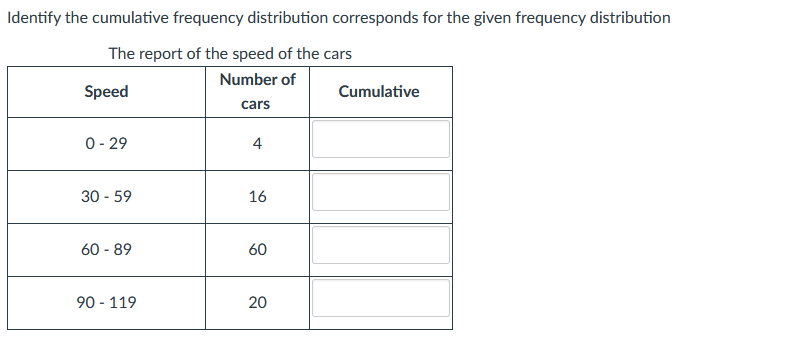
Q: Identify the cumulative frequency distribution corresponds for the given frequency distribution The…
A: According to the given information, we have The frequency distribution table is given.
Q: Make Frequency Distribution Table Compute for the Mean, Median and Mode, SD and CV
A: Given data : 10,16,16,12,16,14,12,14,16,18,12,10,18,10,14,16,14,8,10,16,18,16,14,16,8
Q: Construct a frequency distribution
A:
Q: ive at least one example for each type of frequency distribution. Cumulative frequency…
A: Number of times a variate value is repeated is called its frequency. CF is the number of…
Q: The frequency of repair for the trucks owned by a trucking firm over a 5-year period has been…
A: Here in the given table we notice that first interval is 1.5-2.5 with a midpoint…
Q: B. Construct a less than cumulative frequency curve for the data above. c. Use the cumulative…
A: Construct the cumulative frequency table as follows, S. NO. OVERTIME EARNINGS (OMR) NO. OF…
Q: Construct a frequency distribution table using the following data. (NOTE: Show your computation)…
A: We want to find the Frequency distribution table
Q: Based on this histogram, draw the ogive (the cumulative relative frequency polygon) for the data.
A: By using the given histogram, the cumulative relative frequency is, Selling time Relative…
Q: Construct a frequency distribution table.
A: here AS PER POLICY I HAVE CALCULATED FIRST MAIN QUESTION PLZ REPOST FRP REMAINING HERE frequency is…
Q: Explain the advantage of grouping the data in a frequency distribution table
A: Frequency distribution table- It gives the count of occurrence of any event. It summarizes the the…
Q: A frequency distribution of the airborne speeds in miles per hour of planes is shown. Determine the…
A:
Q: Among fatal plane crashes that occurred during the past 60 years, 580 were due to pilot error, 52…
A: The given data is Cause Frequency Pilot error 580 Other human error 52 Weather 169…
Q: What is the class width for a frequency distribution with 7 classes?
A:
Q: Construct a Frequency Distribution Table
A: We want to construct Frequency distribution table
Q: Use your cumulative frequency diagram to estimate (i) the median value
A: The provided frequency distribution is Class Frequency (f) cf 16-25 8 8 26-35 32 40 36-45…
Q: For a continuous data distribution, 10-20 with frequency 3, 20-30 with
A: Given, a continuous data distribution : Class Frequency 10-20 3 20-30 5 30-40 7 40-50 1…
Q: а. Construct a relative frequency distribution. b. Construct a cumulative frequency distribution. c.…
A: Given Data :
Q: Question b. Find the percentage of these adults who possess 7 or fewer credit cards. c. Draw an…
A: The frequency of the discrete or continuous can be represented in graphical format. The cumulative…
Q: Use the given frequency distribution to find the (a) class width. (b) class midpoints. (c) class…
A: Given freq. distribution table is Temp.( 0F) Freq. 32-36 1 37-41 3 42-46 5 47-51 11…
Q: Complete the frequency distribution table For (50) concrete pieces produced by a factory : Class…
A:
Q: What is the sum of all frequencies in a frequency distribution?
A: Frequency distribution is the overview of all distinct variable/classes and the number the times it…
Q: The following table gives the frequency distribution of the highest degrees held by 25…
A: Given,
Q: Question a. Prepare a cumulative frequency distribution. b. Calculate the cumulative relative…
A: Frequency is the counts of observation occur in the data set. Relative frequency represent the…
Q: Based on this histogram, draw the ogive (the cumulative relative frequency polygon) for the data in…
A: From provided histogram, the table of frequency distribution can be written as: Classes…
Q: What is the class width for a frequency distribution with 6 classes?
A: Here given data for average number of pupils per teacher Maximum = 25 Minimum = 10
Q: Define frequency distribution?
A: Frequency distribution, in statistics, a graph or data set organized to show the frequency of…
Q: following table summarizes the ages of 128 people qualifying for disability insurance. Use the…
A:
Q: While constructing Frequency Distribution, the number of classes used depends upon... a. Number of…
A: The rule 2k can be used here to identify the number of classes. The 2k rule can be stated as: 2k≥n…
Q: Construct the cumulative frequency distribution for the given data. Age (years) of Best Actress when…
A: We are given the following table We need to find the cumulative frequency distribution
Q: Construct a frequency distribution.
A:
Q: Construct a frequency and relative frequency distribution table: (Round relative frequences to 2…
A:
Q: 1. Explain why we organize data into a frequency distribution. 2. Differentiate frequency array…
A:
Q: a) Represent data by using Cumulative Frequency Polygon. b) Find Population Standard Deviation.
A: Part a: We plot the less than cumulative frequency polygon using the step by step procedure in excel…
Q: Among fatal plane crashes that occurred during the past 50 years, 481 were due to pilot error, 99…
A: The number of values corresponding to a class or observation is defined as the frequency of that…
Q: A sale representative for a publishing company recorded the following numbers of client contacts for…
A:
Q: What is the Class Width for this frequency distribution? (fill in the blank below) Class Width =…
A: Given Data : Class Limits Frequency 0.1 - 1.5 10 1.6 - 3.0 14 3.1 -…


Trending now
This is a popular solution!

Step by step
Solved in 2 steps

- A cumulative frequency distribution associates each value in a data set with the proportion of observations in the data set that have the specified value proportion of observations in the data set that have the specified value or lesser value number of observations in the data set that have the specified value number of observations in the data set that have the specified value or a lesser valueUse the central limit theorem to find the mean and standard error of the mean of the indicated sampling distribution. Then sketch a graph of the sampling distribution. The per capita consumption of red meat by people in a country in a recent year was normally distributed, with a mean of 109 pounds and a standard deviation of 37.9pounds. Random samples of size are drawn from this population and the mean of each sample is determined.Use the central limit theorem to find the mean and standard error of the mean of the indicated sampling distribution. Then sketch a graph of the sampling distribution. The per capita consumption of red meat by people in a country in a recent year was normally distributed, with a mean of 109pounds and a standard deviation of 37.9 pounds. Random samples of size 19 are drawn from this population and the mean of each sample is determined. μx= σx=
- Use the central limit theorem to find the mean and standard error of the mean of the indicated sampling distribution. Then sketch a graph of the sampling distribution. The per capita consumption of red meat by people in a country in a recent year was normally distributed, with a mean of 116 pounds and a standard deviation of 38.3. pounds. Random samples of size 20 are drawn from this population and the mean of each sample is determined. μx=____Use the central limit theorem to find the mean and standard error of the mean of the indicated sampling distribution. Then sketch a graph of the sampling distribution. The per capita consumption of red meat by people in a country in a recent year was normally distributed, with a mean of 114 pounds and a standard deviation of 38.8 pounds. Random samples of size 15 are drawn from this population and the mean of each sample is determined. mu Subscript x overbar=Calculate the number based cumulative frequency distribution, Qn, and differential frequency distribution, qn, and tabulate values (showing units) at appropriate grid points xi. answers attached
- A company manufactures batteries in batches of 6 and there is a 3% rate of defects. Find the mean number of defects per batch. Round to the nearest tenth as needed.Use the central limit theorem to find the mean and standard error of the mean of the indicated sampling distribution. Then sketch a graph of the sampling distribution. The per capita consumption of red meat by people in a country in a recent year was normally distributed, with a mean of 102 pounds and a standard deviation of 37.1 pounds. Random samples of size 17 are drawn from this population and the mean of each sample is determined.Use the central limit theorem to find the mean and standard error of the mean of the indicated sampling distribution. Then sketch a graph of the sampling distribution. The per capita consumption of red meat by people in a country in a recent year was normally distributed, with a mean of 107 pounds and a standard deviation of 37.8 pounds. Random samples of size 19 are drawn from this population and the mean of each sample is determined. μx=nothing
- Use the central limit theorem to find the mean and standard error of the mean of the indicated sampling distribution. Then sketch a graph of the sampling distribution. The per capita consumption of red meat by people in a country in a recent year was normally distributed, with a mean of 100 pounds and a standard deviation of 38.6 pounds. Random samples of size 20 are drawn from this population and the mean of each sample is determined. ux= o-x= graph=Use the central limit theorem to find the mean and standard error of the mean of the indicated sampling distribution. Then sketch a graph of the sampling distribution. The per capita consumption of red meat by people in a country in a recent year was normally distributed, with a mean of 106 pounds and a standard deviation of 38.6 pounds. Random samples of size 17 are drawn from this population and the mean of each sample is determined. Ux = Standard deviation =The inner diameters of washers produced by a company can be measured to the nearest thousandth of an inch. If the class marks of a frequency distribution of these diameters are given in inches by 0.587, 0.602 and 0.617, and the class limits of these class marks are