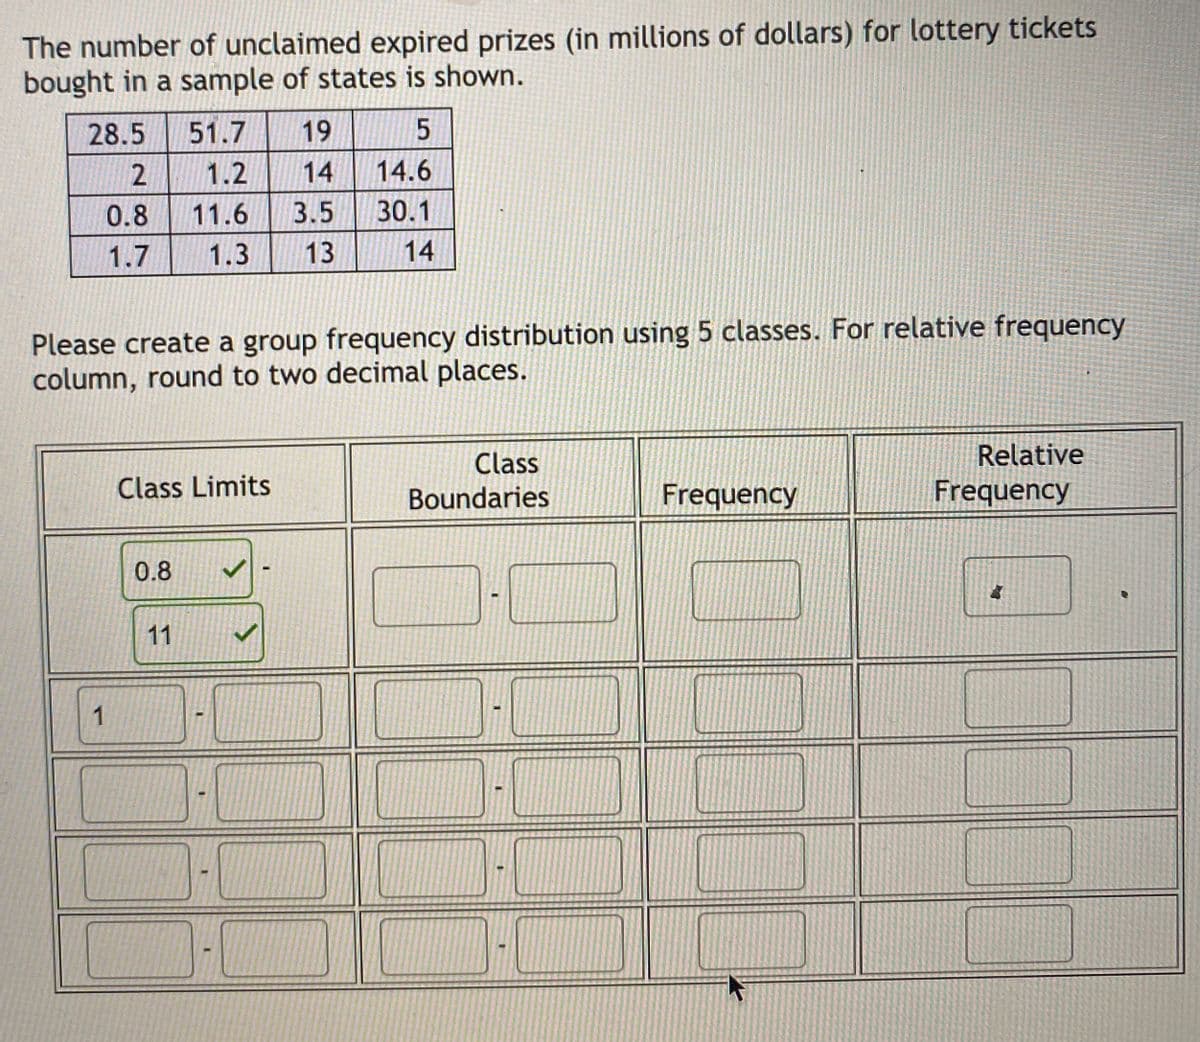
Please create a group frequency distribution using 5 classes. For relative frequency column, round to two decimal places.


Q: If the class mid points in a frequency distribution of age of a group of persons are 14, 22, 30, 38,…
A: The mid points in a frequency distribution of age of a group of persons are given as: 14, 22, 30,…
Q: A person has decided to construct a frequency distribution for a set of data containing 60 numbers.…
A: Solution Step 1 Min value = Min = 23 Max value = Max = 68 No. of classes = k =5
Q: Explain Bionomial distribution with examples?
A: X~Binom(n , p) =========== Formula : P(X =x) = nxpx(1-p)n-x ; x= 0,1,2,..,n
Q: ーノ3ラー Construct a Relative Frequency Histogram using the class boundaries on the horizontal axis.
A:
Q: The marks scored by 25 students in an examination is recorded as follows. 13, 16, 22, 32, 45, 23,…
A: Hi! Thank you for the question, As per the honor code, we are allowed to answer three sub-parts at a…
Q: Make Frequency Distribution Table Compute for the Mean, Median and Mode, SD and CV
A: Given data : 10,16,16,12,16,14,12,14,16,18,12,10,18,10,14,16,14,8,10,16,18,16,14,16,8
Q: Construct a frequency distribution
A:
Q: Construct a frequency distribution and a relative frequency histogram for the data set using five…
A: Obtain the frequency distribution table. The width of the class is determined below: From the…
Q: CREATE A FREQUENCY DISTRIBUTION TABLE JUST LIKE IN THE PICTURE FOR THE GIVEN DATA: 12, 14, 15, 17,…
A: Given 12, 14, 15, 17, 18, 18, 18, 19, 19, 20, 21, 22, 23, 23, 25, 26, 26, 27, 28, 29, 30, 31, 33,…
Q: If the first class in the frequency distribution starts at 19 and the class width is 4, then the…
A:
Q: Explain the meaning of the specified term Population distribution
A:
Q: i believe its the explanation What is the sum of all frequencies in a frequency distribution
A: the sum of all frequencies in a frequency distribution is a cumulative distribution function .
Q: Can the X-bar chart be used in order to see if the number of defectivesin a production timeslot is…
A: There are two types of Control charts: 1) Control charts for variables. 2) Control charts for…
Q: Construct a frequency distribution table.
A: here AS PER POLICY I HAVE CALCULATED FIRST MAIN QUESTION PLZ REPOST FRP REMAINING HERE frequency is…
Q: Explain the advantage of grouping the data in a frequency distribution table
A: Frequency distribution table- It gives the count of occurrence of any event. It summarizes the the…
Q: create a frequency distribution table using this formula 2, 4, 4, 4, 4, 5, 5, 5, 6, 6, 7, 7, 8, 8,…
A: Frequency Distribution: One particularly useful tool in grouping the data is the frequency…
Q: Determine the speed corresponding to the 75th percentile.
A:
Q: professor Reep number of social interactions over the week is shown in the following grouped…
A: Given : Lower class limit for first class = 10
Q: What is the bin in this dataset to calculate the frequency?
A: Country beer_servings Spirit_servings Wine_servings Total_litres_of_pure_alhocol Afganisthan 0 0 0…
Q: Among fatal plane crashes that occurred during the past 60 years, 580 were due to pilot error, 52…
A: The given data is Cause Frequency Pilot error 580 Other human error 52 Weather 169…
Q: Whats the step by step process in excel for getting the frequency distribution and percentage…
A: Excel procedure for frequency distribution: Type your data into a worksheet Sort the data in…
Q: The is the difference between consecutive lower class limits. The is the difference between…
A: answer: class width
Q: Construct a Frequency Distribution Table
A: We want to construct Frequency distribution table
Q: Use your cumulative frequency diagram to estimate (i) the median value
A: The provided frequency distribution is Class Frequency (f) cf 16-25 8 8 26-35 32 40 36-45…
Q: Identify the cumulative frequency distribution corresponds for the given frequency distribution
A: We have to find the cumulative frequency for the given frequency distribution.
Q: For a continuous data distribution, 10-20 with frequency 3, 20-30 with
A: Given, a continuous data distribution : Class Frequency 10-20 3 20-30 5 30-40 7 40-50 1…
Q: Question b. Find the percentage of these adults who possess 7 or fewer credit cards. c. Draw an…
A: The frequency of the discrete or continuous can be represented in graphical format. The cumulative…
Q: What is the sum of all frequencies in a frequency distribution?
A: Frequency distribution is the overview of all distinct variable/classes and the number the times it…
Q: Suppose a data set ranges from a low value of 29 and a high value of 62. Calculate the class width…
A: width of class interval = range / number of classes
Q: Provide the following 1. frequency distribution table 2. frequency histogram 3. frequency…
A: Hi! Thank you for the question, As per the honor code, we are allowed to answer three sub-parts at a…
Q: Put it in a frequency distribution table.
A:
Q: Determine the class width of the data if 5 classes are desired. Complete a frequency table using…
A:
Q: Demonstrate a Frequency Distribution Table for Tampa, Florida, and Columbus, Ohio. Please show work…
A: Frequency distribution for Number of cases produced(Tampa, Florida): Minimum value=684 Maximum…
Q: The figure below shows the comparative box plots for a manufacturing quality index on semiconductor…
A: In the shape 3 the median is close the first quartile. So it has a tail on the right side. So it is…
Q: If the prices of 500 pieces of jewelry (in peso and in centavo) are such lowest is 435.00 and the…
A: In this case, the minimum value is 435 and the maximum value is 95,795. Hence, the range is n =…
Q: What is the class width for a frequency distribution with 6 classes?
A: Here given data for average number of pupils per teacher Maximum = 25 Minimum = 10
Q: Construct a frequency distribution and a frequency histogram for the data set. Describe the shape of…
A: Construct the frequency distribution for the energy consumption of natural gas. Consider that the…
Q: Define frequency distribution?
A: Frequency distribution, in statistics, a graph or data set organized to show the frequency of…
Q: While constructing Frequency Distribution, the number of classes used depends upon... a. Number of…
A: The correct option is (D) Size of class Size of class remains the same for all class intervals and…
Q: Construct a frequency distribution.
A:
Q: The following table shows the results of 20 random Full Sail college students when asked the number…
A:
Q: Create a relative frequency table for the numbers 2, 2, 2, 3, 3
A: A relative frequency is the fraction of times a number occurs. To find the relative frequencies,…
Q: Construct a frequency and relative frequency distribution table: (Round relative frequences to 2…
A:
Q: Suppose you compile all possible samples of 25 children of preschool age in your school district. If…
A: Sampling distribution of sample mean:A sampling distribution of the sample mean for a given sample…
Q: 1. Explain why we organize data into a frequency distribution. 2. Differentiate frequency array…
A:
Q: A sale representative for a publishing company recorded the following numbers of client contacts for…
A:
Q: What is the Class Width for this frequency distribution? (fill in the blank below) Class Width =…
A: Given Data : Class Limits Frequency 0.1 - 1.5 10 1.6 - 3.0 14 3.1 -…
Q: Prepare a Frequency Distribution Table (FDT) and interpret the results. Please follow the four (4)…
A: Given Scores obtained by 2nd-year BSBA class in their 100-term BANA 2 midterm examination are given.


Trending now
This is a popular solution!

Step by step
Solved in 2 steps


- Persons per Housing Unit. From the document American Housing Survey for the United States, published by the U.S. Census Bureau, we obtained the following frequency distribution for the number of persons per occupied housing unit, where we have used “7” in place of “7 or more.” Frequencies are in millions of housing units. Persons 1 2 3 4 5 6 7 Frequency 27.9 34.4 17.0 15.5 6.8 2.3 1.4 For a randomly selected housing unit, let Y denote the number of persons living in that unit. a. Identify the possible values of the random variable Y .b. Use random-variable notation to represent the event that a housing unit has exactly three persons living in it.c. Determine P(Y = 3); interpret in terms of percentages.d. Determine the probability distribution of Y .e. Construct a probability histogram for Y .Suppose that 77% of the students at a small private university carry student loans. For a SRS of students at this university, let P(hat) be the sample proportion of the students who carry student loans. How large would a sample from this population need to be to ensure that the distribution of the sample proportion is normally distributed?A economists obtained a random sample of U.S. consumers to determine whether there were any preferences among cars from different manufacturing countries. After the data were collected, the researchers obtained the frequency distribution below. What can be concluded with ? = 0.10? United States Japan Germany 19 35 29 a) What is the appropriate test statistic? ---Select--- na z-test One-Sample t-test Independent-Samples t-test Related-Samples t-test One-Way ANOVA Within-Subjects ANOVA Two-Way ANOVA Correlation Slope Chi-Square GoF Chi-Square IndependenceCompute the statistic selected in a): b) Obtain/compute the appropriate values to make a decision about H0.Critical Value = ; Test Statistic = Decision: ---Select--- Reject H0 Fail to reject H0c) Compute the corresponding effect size(s) and indicate magnitude(s).If not appropriate, input and/or select "na" below.Effect Size = ; Magnitude: ---Select--- na trivial effect small effect medium effect large effectd) Make an…
- Following is a list of 21 African nations for which information is available on voter turnout (percentage of the voting age population) for president between 2005 and 2008. Compute and interpret the median and mean percentage turnout. TABLE 3.6 Presidential Voter Turnout, 21 African Countries, 2005–2008Country Year % Turnout VAPBurkina Faso 2005 36.4Cape Verde 2006 78.59Central African Republic 2005 45.14Chad 2006 71.4Comoros 2006 52.14Djibouti 2005 67.82Egypt 2005 16.41Gabon 2005 51.47Gambia 2006 50.66Guinea-Bissau 2005 66.84Kenya 2007 54.49Liberia 2005 59.01Madagascar 2006 50.85Mali 2007 48.18Mauritania 2007 53.55São Tomé and Príncipe 2006 69.76Senegal 2007 55.11Seychelles 2006 97.08Sierra Leone 2007 62.02Zambia 2008 34.18Zimbabwe 2008 47.27A health food store owner determined that 21% of her customers bake their own bread each week. A random sample of 75 customers are asked if they bake their own bread each week and 15% of them said they did. What is the mean of the sampling distribution of ?Please answer all sub-parts According to the manufacturer of M&Ms, 12% of peanut M&Ms in a bag should be brown, 15% yellow, 12% red, 23% blue, 23% orange, and 15% green. A student randomly selects a bag of peanut M&Ms. For the 400 M&Ms in the bag, the the number of M&Ms that were of each color is in the table below. At the ? = 0.05 level, does the data support the manufacturer's claim for the distribution of colors of peanut M&Ms? (Note: We did not give the Expected Counts, you will need to compute them yourself.) Color Frequency Brown 53 Yellow 66 Red 38 Blue 96 Orange 88 Green 59 Complete the hypothesis test: a) State the null and alternative hypotheses: H0 and H1 b) Compute the ?2 statistic c) Give the critical ?2 value (from Table VIII). d) State the conclusion