Identify the null and alternative hypotheses. Α Ho: μ>10 B. Ho: H+ 10 c. Ho μ= 10 H4: µ= 10 Η: μ= 10 H4: µ#10 D. Ho : μ< 10 E. Ho: μ= 10 H1:µ< 10 F. Ho: H= 10 H1: µ> 10 Η: μ= 10 Identify the critical region. Select the correct choice below and fill in the answer box(es) to complete your choice. (Round to two decimal places as needed.) A. t> О В. t< or t> Oc. t<
Identify the null and alternative hypotheses. Α Ho: μ>10 B. Ho: H+ 10 c. Ho μ= 10 H4: µ= 10 Η: μ= 10 H4: µ#10 D. Ho : μ< 10 E. Ho: μ= 10 H1:µ< 10 F. Ho: H= 10 H1: µ> 10 Η: μ= 10 Identify the critical region. Select the correct choice below and fill in the answer box(es) to complete your choice. (Round to two decimal places as needed.) A. t> О В. t< or t> Oc. t<

MATLAB: An Introduction with Applications
6th Edition
ISBN:9781119256830
Author:Amos Gilat
Publisher:Amos Gilat
Chapter1: Starting With Matlab
Section: Chapter Questions
Problem 1P

Related questions
Question
100%
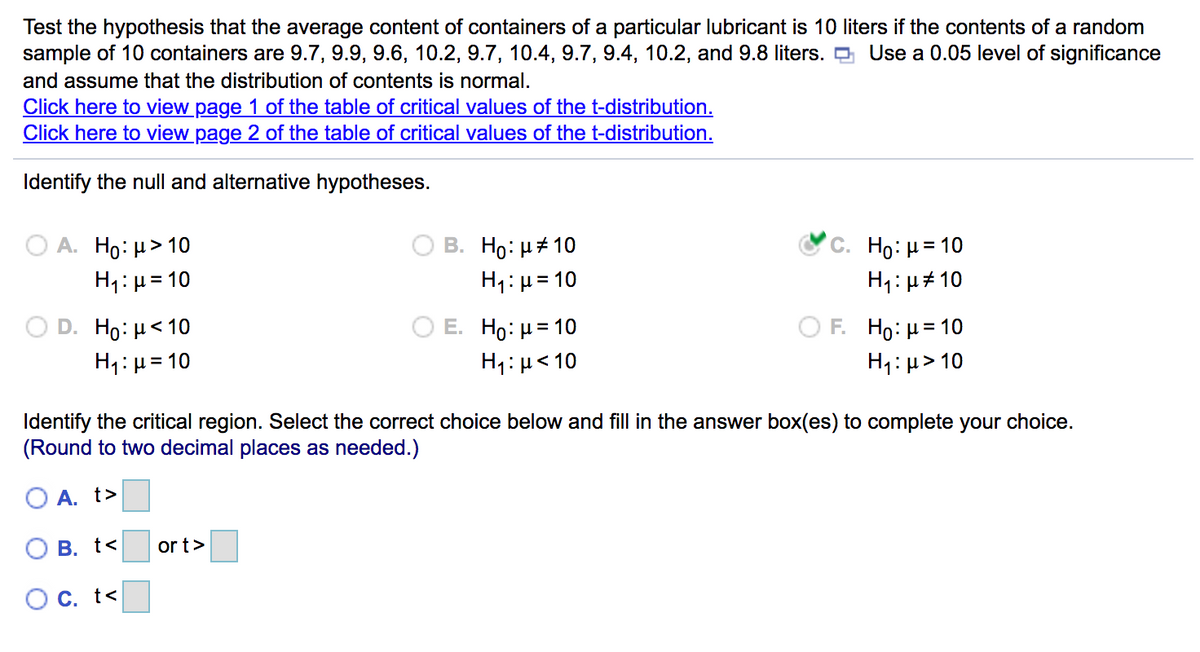
Transcribed Image Text:Test the hypothesis that the average content of containers of a particular lubricant is 10 liters if the contents of a random
sample of 10 containers are 9.7, 9.9, 9.6, 10.2, 9.7, 10.4, 9.7, 9.4, 10.2, and 9.8 liters.
Use a 0.05 level of significance
and assume that the distribution of contents is normal.
Click here to view page 1 of the table of critical values of the t-distribution.
Click here to view page 2 of the table of critical values of the t-distribution.
Identify the null and alternative hypotheses.
Ο Α. Ho: μ> 10
H1:µ= 10
B. Ho: H# 10
H1: µ= 10
C. Ho: μ 10
H4: µ#10
D. Ho μ<10
E. Ho: µ= 10
F. Ho: µ= 10
H1:µ=10
H1:µ<10
H1:µ> 10
Identify the critical region. Select the correct choice below and fill in the answer box(es) to complete your choice.
(Round to two decimal places as needed.)
O A. t>
О в. t<
or t>
O C. t<
Expert Solution
This question has been solved!
Explore an expertly crafted, step-by-step solution for a thorough understanding of key concepts.

Step by step
Solved in 2 steps with 2 images

Knowledge Booster


Learn more about
Need a deep-dive on the concept behind this application? Look no further. Learn more about this topic, statistics and related others by exploring similar questions and additional content below.Recommended textbooks for you
MATLAB: An Introduction with Applications
Statistics
ISBN:
9781119256830
Author:
Amos Gilat
Publisher:
John Wiley & Sons Inc

Probability and Statistics for Engineering and th…
Statistics
ISBN:
9781305251809
Author:
Jay L. Devore
Publisher:
Cengage Learning

Statistics for The Behavioral Sciences (MindTap C…
Statistics
ISBN:
9781305504912
Author:
Frederick J Gravetter, Larry B. Wallnau
Publisher:
Cengage Learning
MATLAB: An Introduction with Applications
Statistics
ISBN:
9781119256830
Author:
Amos Gilat
Publisher:
John Wiley & Sons Inc
Probability and Statistics for Engineering and th…
Statistics
ISBN:
9781305251809
Author:
Jay L. Devore
Publisher:
Cengage Learning
Statistics for The Behavioral Sciences (MindTap C…
Statistics
ISBN:
9781305504912
Author:
Frederick J Gravetter, Larry B. Wallnau
Publisher:
Cengage Learning

Elementary Statistics: Picturing the World (7th E…
Statistics
ISBN:
9780134683416
Author:
Ron Larson, Betsy Farber
Publisher:
PEARSON

The Basic Practice of Statistics
Statistics
ISBN:
9781319042578
Author:
David S. Moore, William I. Notz, Michael A. Fligner
Publisher:
W. H. Freeman

Introduction to the Practice of Statistics
Statistics
ISBN:
9781319013387
Author:
David S. Moore, George P. McCabe, Bruce A. Craig
Publisher:
W. H. Freeman