) Identify the Z value in the following diagram of the standard normal distribution (interpolate, as neded) 0.668 probability.
) Identify the Z value in the following diagram of the standard normal distribution (interpolate, as neded) 0.668 probability.

College Algebra
7th Edition
ISBN:9781305115545
Author:James Stewart, Lothar Redlin, Saleem Watson
Publisher:James Stewart, Lothar Redlin, Saleem Watson
Chapter9: Counting And Probability
Section9.3: Binomial Probability
Problem 2E: If a binomial experiment has probability p success, then the probability of failure is...

Related questions

Topic Video
Question
Transcribed Image Text:(0.3)
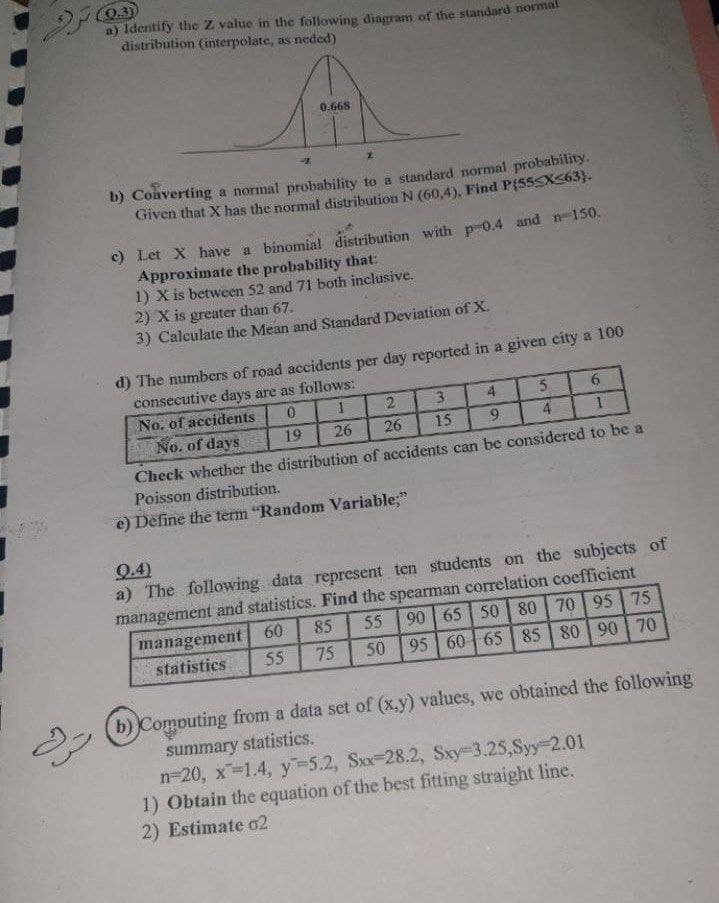
a) Identify the Z value in the following diagram of the standard norma
distribution (interpolate, as neded)
0.668
b) Converting a normal probability to a standard normal probability.
Given that X has the normal distribution N (60,4), Find P{55SX363}.
) Let X have a binomial distribution with p 0.4 and n150.
Approximate the probability that:
1) X is between 52 and 71 both inclusive.
2) X is greater than 67.
3) Calculate the Mean and Standard Deviation of X.
d) The numbers of road accidents per day reported in a given city a 100
consecutive days are as follows:
No. of accidents
No. of days
2
3
4
5.
19
26
26
15
9.
4.
Check whether the distribution of accidents can be considered to be a
Poisson distribution.
e) Define the term "Random Variable;"
9.4)
a) The following data represent ten students on the subjects of
management and statistics. Find the spearman correlation coefficient
90 65 50 | 80 70 95 75
95 60 65 | 85 80 90 70
management 60
75
55
85
55
statistics
50
b) Computing from a data sct of (x.y) values, we obtained the following
summary statistics.
n-20, x-1.4, y-5.2, Sxx-28.2, Sxy-3.25,Syy 2.01
1) Obtain the equation of the best fitting straight line.
2) Estimate o2
Expert Solution
This question has been solved!
Explore an expertly crafted, step-by-step solution for a thorough understanding of key concepts.

Step by step
Solved in 2 steps with 1 images

Knowledge Booster


Learn more about
Need a deep-dive on the concept behind this application? Look no further. Learn more about this topic, probability and related others by exploring similar questions and additional content below.Recommended textbooks for you
College Algebra
Algebra
ISBN:
9781305115545
Author:
James Stewart, Lothar Redlin, Saleem Watson
Publisher:
Cengage Learning

Algebra & Trigonometry with Analytic Geometry
Algebra
ISBN:
9781133382119
Author:
Swokowski
Publisher:
Cengage

College Algebra
Algebra
ISBN:
9781305115545
Author:
James Stewart, Lothar Redlin, Saleem Watson
Publisher:
Cengage Learning
Algebra & Trigonometry with Analytic Geometry
Algebra
ISBN:
9781133382119
Author:
Swokowski
Publisher:
Cengage