1. What characteristics must a normal probability distribution have to be a standard normal probability distribution? 2. Find the shaded area under each standard normal curve shown below:
1. What characteristics must a normal probability distribution have to be a standard normal probability distribution? 2. Find the shaded area under each standard normal curve shown below:

Glencoe Algebra 1, Student Edition, 9780079039897, 0079039898, 2018
18th Edition
ISBN:9780079039897
Author:Carter
Publisher:Carter
Chapter10: Statistics
Section10.4: Distributions Of Data
Problem 19PFA

Related questions
Question
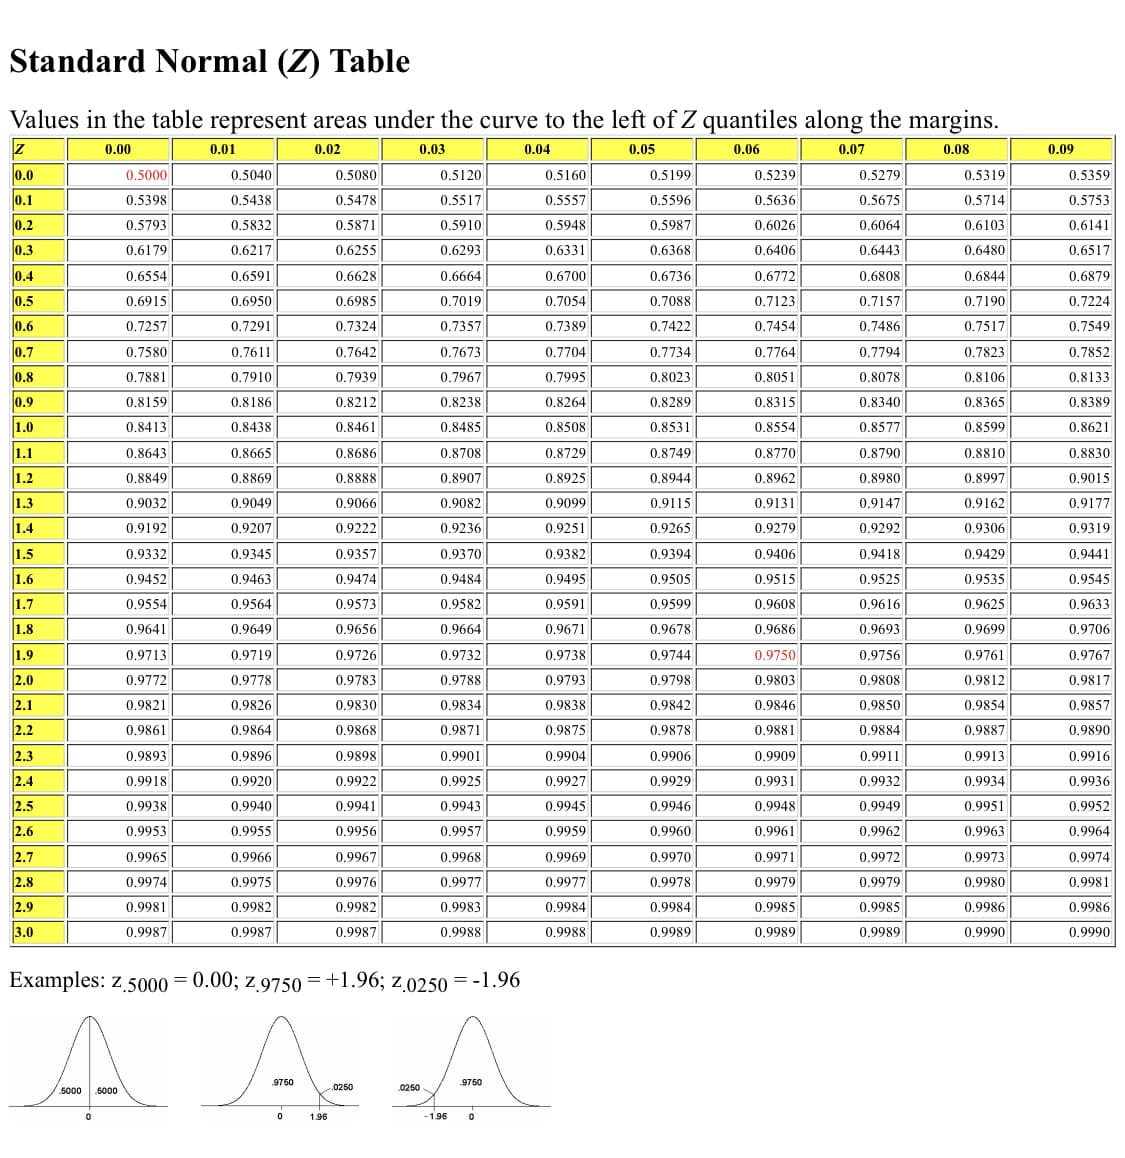
Transcribed Image Text:Standard Normal (Z) Table
Values in the table represent areas under the curve to the left of Z quantiles along the margins.
0.00
0.02
0.03
0.04
0.05
0.06
0.07
0.08
Z
0.0
0.1
0.2
0.3
0.4
0.5
0.6
0.7
0.8
0.9
1.0
1.1
1.2
1.3
1.4
1.5
1.6
1.7
1.8
1.9
2.0
2.1
2.2
2.3
2.4
2.5
2.6
2.7
2.8
2.9
3.0
0.5000
0.5398
0.5793
0.6179
0.6554
0.6915
0.7257
0.7580
0.7881
0.8159
0.8413
0.8643
0.8849
0.9032
0.9192
0.9332
0.9452
0.9554
0.9641
0.9713
0.9772
0.9821
0.9861
0.9893
0.9918
0.9938
0.9953
0.9965
0.9974
0.9981
0.9987
0.01
0.5040
0.5438
0.5832
0.6217
0.6591
0.6950
0.7291
0.7611
0.7910
0.8186
0.8438
0.8665
0.8869
0.9049
0.9207
0.9345
0.9463
0.9564
0.9649
0.9719
0.9778
0.9826
0.9864
0.9896
0.9920
0.9940
0.9955
0.9966
0.9975
0.9982
0.9987
.9750
0
0.5080
0.5478
0.5871
0.6255
0.6628
0.6985
0.7324
0.7642
0.7939
0.8212
0.8461
0.8686
0.8888
0.9066
0.9222
0.9357
0.9474
0.9573
0.9656
0.9726
0.9783
0.9830
0.9868
0.9898
0.9922
0.9941
Examples: z.5000=0.00; z.9750=+1.96; Z.0250 = -1.96
A
5000
5000
1.96
0.9956
0.9967
0.9976
0.9982
0.9987
0250
0.5120
0.5517
0.5910
0.6293
0.6664
0.7019
0.7357
0.7673
0.7967
0.8238
0.8485
0.8708
0.8907
0.9082
0.9236
0.9370
0.9484
0.9582
0.9664
0.9732
0.9788
0.9834
0.9871
0.9901
0.9925
0.9943
0.9957
0.9968
0.9977
0.9983
0.9988
0250
-1.96
9750
0
0.5160
0.5557
0.5948
0.6331
0.6700
0.7054
0.7389
0.7704
0.7995
0.8264
0.8508
0.8729
0.8925
0.9099
0.9251
0.9382
0.9495
0.9591
0.9671
0.9738
0.9793
0.9838
0.9875
0.9904
0.9927
0.9945
0.9959
0.9969
0.9977
0.9984
0.9988
0.5199
0.5596
0.5987
0.6368
0.6736
0.7088
0.7422
0.7734
0.8023
0.8289
0.8531
0.8749
0.8944
0.9115
0.9265
0.9394
0.9505
0.9599
0.9678
0.9744
0.9798
0.9842
0.9878
0.9906
0.9929
0.9946
0.9960
0.9970
0.9978
0.9984
0.9989
0.5239
0.5636
0.6026
0.6406
0.6772
0.7123
0.7454
0.7764
0.8051
0.8315
0.8554
0.8770
0.8962
0.9131
0.9279
0.9406
0.9515
0.9608
0.9686
0.9750
0.9803
0.9846
0.9881
0.9909
0.9931
0.9948
0.9961
0.9971
0.9979
0.9985
0.9989
0.5279
0.5675
0.6064
0.6443
0.6808
0.7157
0.7486
0.7794
0.8078
0.8340
0.8577
0.8790
0.8980
0.9147
0.9292
0.9418
0.9525
0.9616
0.9693
0.9756
0.9808
0.9850
0.9884
0.9911
0.9932
0.9949
0.9962
0.9972
0.9979
0.9985
0.9989
0.5319
0.5714
0.6103
0.6480
0.6844
0.7190
0.7517
0.7823
0.8106
0.8365
0.8599
0.8810
0.8997
0.9162
0.9306
0.9429
0.9535
0.9625
0.9699
0.9761
0.9812
0.9854
0.9887
0.9913
0.9934
0.9951
0.9963
0.9973
0.9980
0.9986
0.9990
0.09
0.5359
0.5753
0.6141
0.6517
0.6879
0.7224
0.7549
0.7852
0.8133
0.8389
0.8621
0.8830
0.9015
0.9177
0.9319
0.9441
0.9545
0.9633
0.9706
0.9767
0.9817
0.9857
0.9890
0.9916
0.9936
0.9952
0.9964
0.9974
0.9981
0.9986
0.9990
Transcribed Image Text:Topic 4 Practice Test
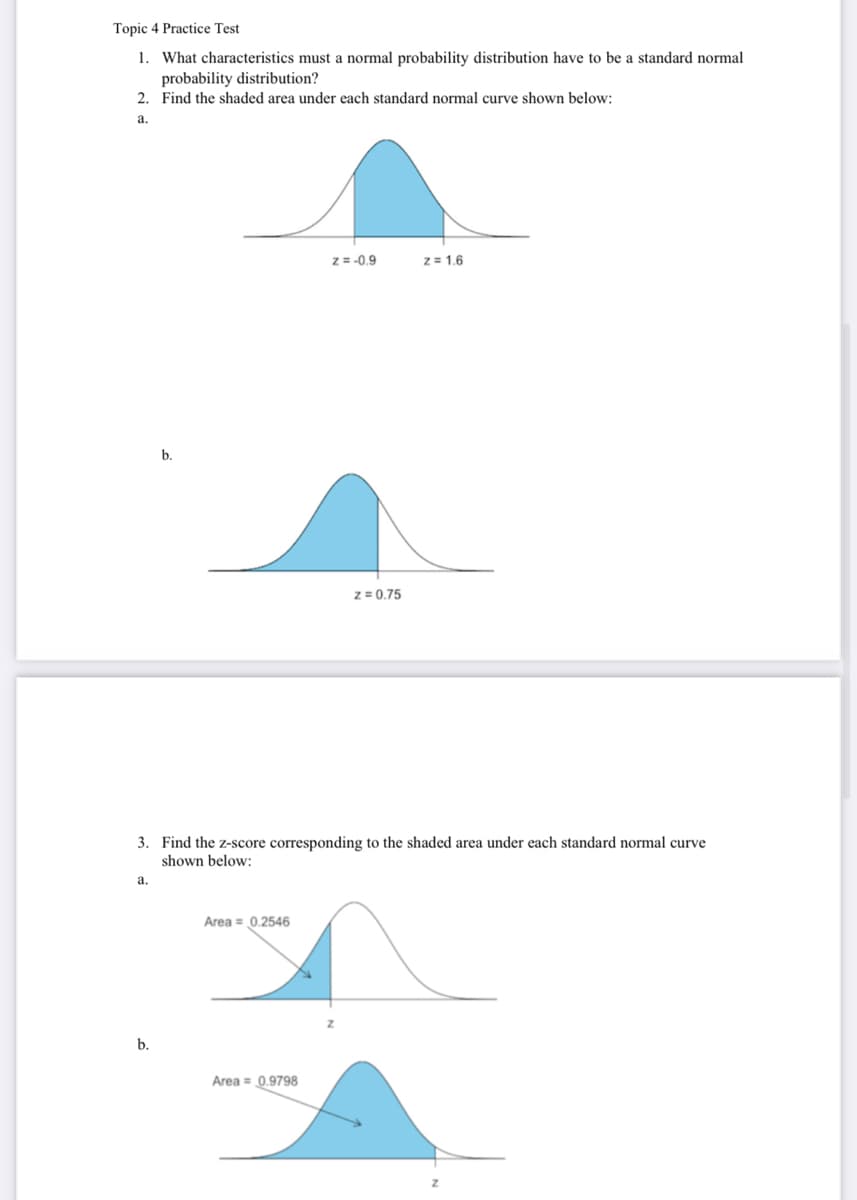
1. What characteristics must a normal probability distribution have to be a standard normal
probability distribution?
2. Find the shaded area under each standard normal curve shown below:
a.
a.
b.
b.
3. Find the z-score corresponding to the shaded area under each standard normal curve
shown below:
Area = 0.2546
z = -0.9
Area = 0.9798
z = 0.75
z = 1.6
Expert Solution
This question has been solved!
Explore an expertly crafted, step-by-step solution for a thorough understanding of key concepts.

Step by step
Solved in 3 steps with 1 images

Recommended textbooks for you
Glencoe Algebra 1, Student Edition, 9780079039897…
Algebra
ISBN:
9780079039897
Author:
Carter
Publisher:
McGraw Hill
Glencoe Algebra 1, Student Edition, 9780079039897…
Algebra
ISBN:
9780079039897
Author:
Carter
Publisher:
McGraw Hill