If a sample of 50 people from this region is selected, what is the probability In a study of the life expectancy of 400 people in a certain geographic region, the mean age death was 70 years, and the standard deviation was 5.1 years. that the mean life
If a sample of 50 people from this region is selected, what is the probability In a study of the life expectancy of 400 people in a certain geographic region, the mean age death was 70 years, and the standard deviation was 5.1 years. that the mean life

Glencoe Algebra 1, Student Edition, 9780079039897, 0079039898, 2018
18th Edition
ISBN:9780079039897
Author:Carter
Publisher:Carter
Chapter10: Statistics
Section10.4: Distributions Of Data
Problem 19PFA

Related questions
Question
complete the following details please
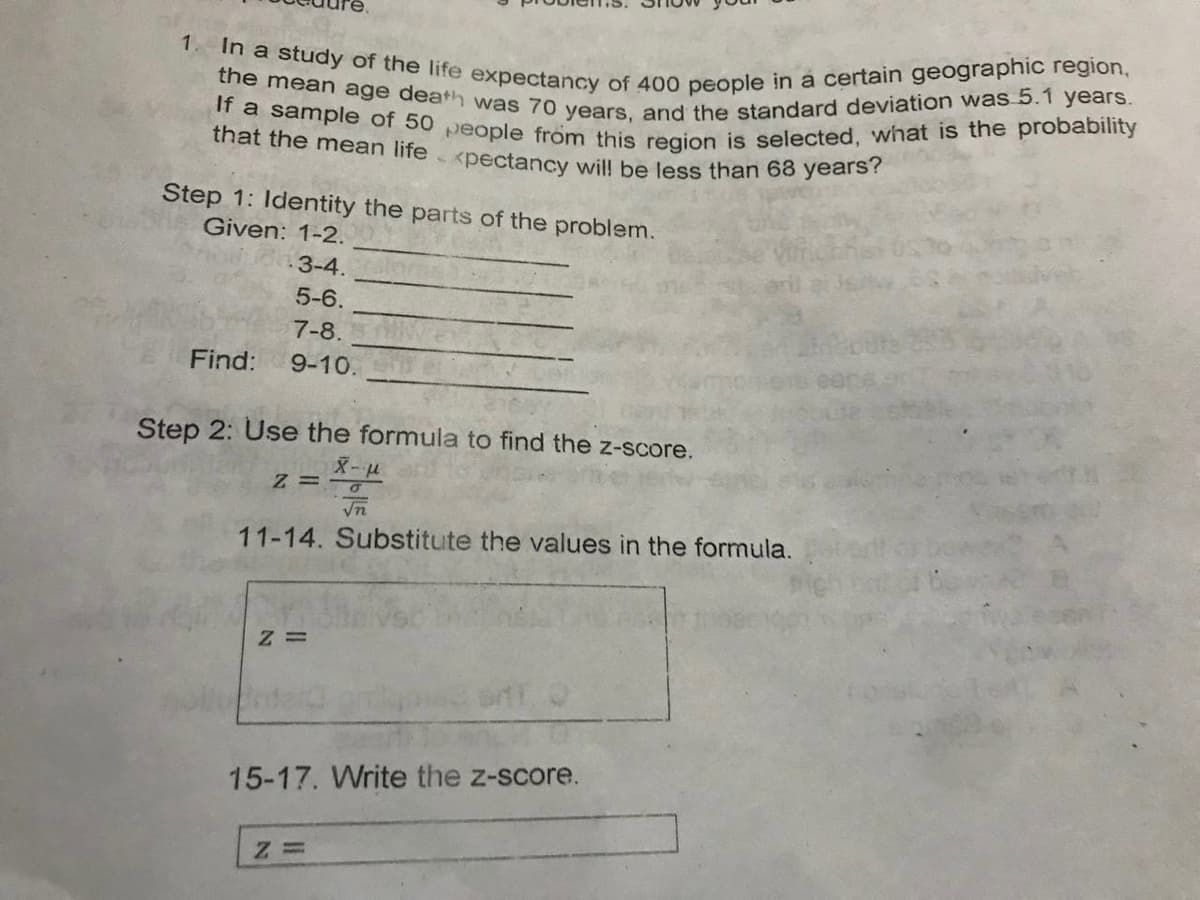
Transcribed Image Text:In a study of the life expectancy of 400 people in a certain geographic region,
If a sample of 50 people from this region is selected, what is the probability
the mean age death was 70 years, and the standard deviation was 5.1 years.
that the mean life <pectancy wil! be less than 68 years?
1.
Step 1: Identity the parts of the problem.
Given: 1-2.
3-4.
5-6.
7-8.
Find:
9-10.
Step 2: Use the formula to find the z-score.
Z = -u
In
11-14. Substitute the values in the formula.
15-17. Write the z-score.
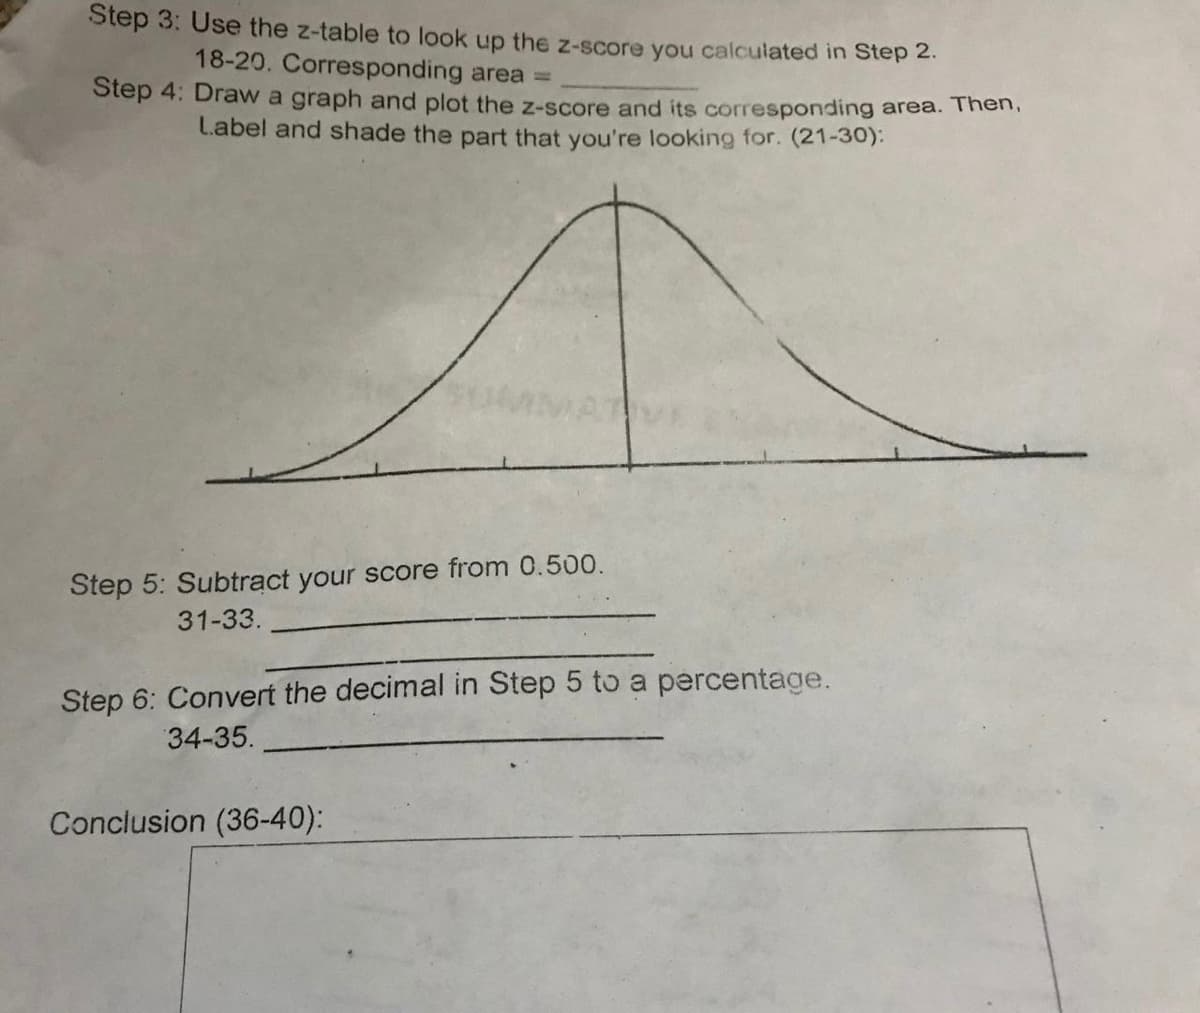
Transcribed Image Text:Step 3: Use the z-table to look up the z-score you calculated in Step 2.
18-20. Corresponding area
Step 4: Draw a graph and plot the z-score and its corresponding area. The
Label and shade the part that you're looking for. (21-30):
Step 5: Subtract your score from 0.500.
31-33.
Step 6: Convert the decimal in Step 5 to a percentage.
34-35.
Conclusion (36-40):
Expert Solution
This question has been solved!
Explore an expertly crafted, step-by-step solution for a thorough understanding of key concepts.

This is a popular solution!

Trending now
This is a popular solution!

Step by step
Solved in 2 steps

Recommended textbooks for you
Glencoe Algebra 1, Student Edition, 9780079039897…
Algebra
ISBN:
9780079039897
Author:
Carter
Publisher:
McGraw Hill
Glencoe Algebra 1, Student Edition, 9780079039897…
Algebra
ISBN:
9780079039897
Author:
Carter
Publisher:
McGraw Hill