PLEASE JUST ANSWER #3 and the correspdonding right under it How many females are in your sample? How many males? What proportion of your sample is female? What proportion of your sample is male? - From the data it is clear that there are 50 persons in the sample. 33 are female and 17 are male. Thus, N(females ) =33 N(males ) =17 Proportion of females = 33/50 =0.66 Proportion of males = 17/50 =0.34 2) Is the proportion of women at StatCrunchU equal to the proportion of men at StatCrunchU? Show that the conditions are met for the use of a normal model for a hypothesis test (np > 10 and n(1 - p) >10, where p is from the null hypothesis). Test the claim that the proportion of females at StatCrunchU is equal to the proportion of men. Document your hypothesis test in hypothesis test format in your submission. Write a conclusion to your hypothesis test referring to females at StatCrunchU. Explain what the P-value means as a probability that refers to random samples of 50 StatCrunchU students. Assuming the students at the university can be classified as males or females only, if the proportion if females is indeed equal to that of males, then half or 0.5 proportion will be females, and the remaining half or 0.5 will be males. Thus, if the proportion if females is equal to that of males, we should expect to have, p = 0.5. The sample size considered here is, n = 50. Denote p̂ as the sample proportion of females. The sampling distribution of the sample proportion, p̂ can be assumed to have a normal model, if the individuals are selected normally, and if np > 10, n (1 – p) > 10, where p is the expected proportion. Here, the sampled individuals are mentioned to have been chosen randomly. Now, np = 50 × 0.5 = 25 > 10. n (1 – p) = 50 × (1 – 0.5) = 50 × 0.5 = 25 > 10. Thus, the conditions are met to use a normal model as the sampling distribution of the sample proportion, p̂, which will facilitate in the hypothesis test. In order to test if the true proportion of females at the university is equal to the proportion of men, the null and alternative hypotheses are as follows: H0: p = 0.5; H1: p ≠ 0.5. The test is two-tailed, and the z-test for one proportion is suitable. The sample size considered is, n = 50. The sampled number of females obtained by counting the number of times “Female” appears in the column “Gender” is, x = 33. Thus, the sampled proportion of females is, p̂ = x/n = 33/50 = 0.66. The formula for the z-test statistic is, z = (p̂ – p)/ √ [p (1 – p)/n]. Thus, z = (p̂ – p)/ √ [p (1 – p)/n] = (0.66 – 0.5) / √ [(0.5) (1 – 0.5) / 50] = (0.16) / √ (0.005) ≈ 2.263. Thus, the value of the test statistic is 2.263. For the two-tailed test, the P-value would be: P-value = P (| Z | ≥ | z |) = P (| Z | ≥ | 2.263 |) = P (Z ≤ –2.263) + P (Z ≥ 2.263) = 2 P (Z ≤ –2.263) [Since the standard normal variable, Z is symmetric about 0] ≈ 2 × 0.0118 [Using the Excel formula: =NORM.S.DIST(-2.263,TRUE), P (Z ≤ –2.263) ≈ 0.0118] = 0.0536. Thus, the P-value of the test is 0.0236. The significance level, α is not specified, so it is assumed by default that, α = 0.05. The decision rule regarding a hypothesis testing problem using the P-value is: Reject H0 if P-value ≤ α. Otherwise fail to reject H0. Here, P-value (≈ 0.0236) < α (= 0.05), reject the null hypothesis H0. Thus, it can be concluded that the proportion of females at the university is not equal to the proportion of males; in other words, the proportion of females at the university is significantly different from the proportion of males at the university. The P-value is the probability of observing sample results at least as extreme as the observed results, given that the null hypothesis is true. In this case, the P-value of 0.0236 indicates that, if the proportion of females at the university is indeed equal to the proportion of males (as assumed in the null hypothesis), then the probability of observing at least as extreme as 33 females in a sample of 50 randomly selected students would be only 0.0236. In other words, if several samples of 50 students from the university are selected randomly, then only about 0.0236 proportion (or, 2.36%) of the sample will have at least as extreme as 33 female students. 3) What are the proportions of females and males at StatCrunch U? Show that the conditions are met for the use of a normal model for a confidence interval (count of successes and failures are greater than 10, as in 2 a). Determine a range of plausible values for this proportion by using your choice of technology. Document your methods below, using screen short from the calculator or other technology as needed. Interpret your interval referring to females at StatCrunchU. Explain what is meant by "95% confident."


PLEASE JUST ANSWER #3 and the correspdonding right under it
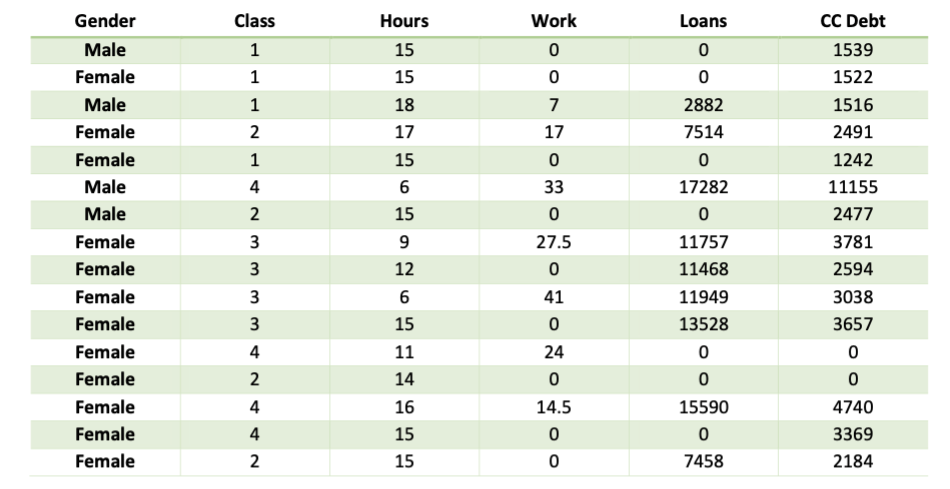
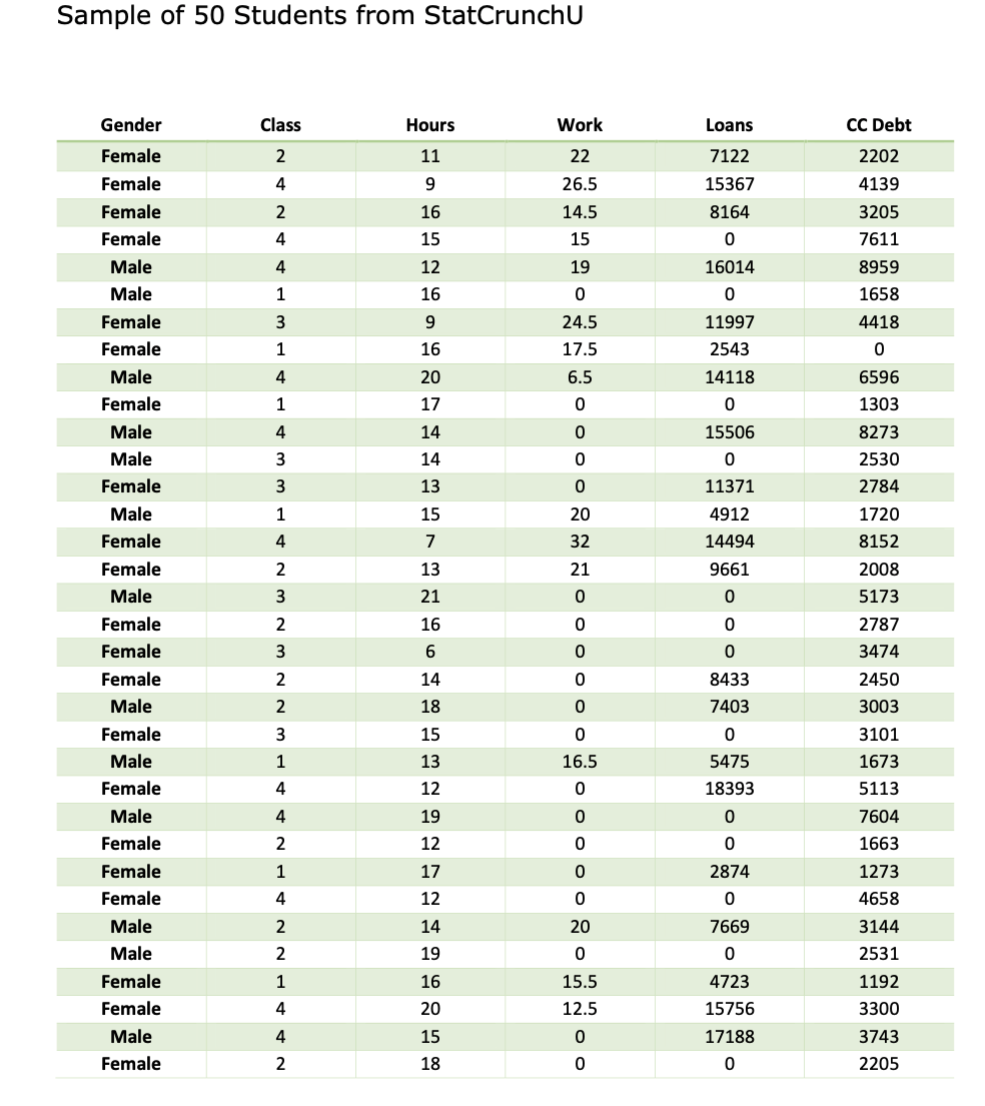
- How many females are in your sample? How many males? What proportion of your sample is female? What proportion of your sample is male?
- From the data it is clear that there are 50 persons in the sample. 33 are female and 17 are male. Thus,
N(females ) =33
N(males ) =17
Proportion of females = 33/50
=0.66
Proportion of males = 17/50
=0.34
2) Is the proportion of women at StatCrunchU equal to the proportion of men at StatCrunchU?
- Show that the conditions are met for the use of a normal model for a hypothesis test (np > 10 and n(1 - p) >10, where p is from the null hypothesis).
- Test the claim that the proportion of females at StatCrunchU is equal to the proportion of men. Document your hypothesis test in hypothesis test format in your submission.
- Write a conclusion to your hypothesis test referring to females at StatCrunchU.
- Explain what the P-value means as a probability that refers to random samples of 50 StatCrunchU students.
Assuming the students at the university can be classified as males or females only, if the proportion if females is indeed equal to that of males, then half or 0.5 proportion will be females, and the remaining half or 0.5 will be males. Thus, if the proportion if females is equal to that of males, we should expect to have, p = 0.5.
The sample size considered here is, n = 50.
Denote p̂ as the sample proportion of females.
The sampling distribution of the sample proportion, p̂ can be assumed to have a normal model, if the individuals are selected normally, and if np > 10, n (1 – p) > 10, where p is the expected proportion.
Here, the sampled individuals are mentioned to have been chosen randomly. Now,
np = 50 × 0.5 = 25 > 10.
n (1 – p) = 50 × (1 – 0.5) = 50 × 0.5 = 25 > 10.
Thus, the conditions are met to use a normal model as the sampling distribution of the sample proportion, p̂, which will facilitate in the hypothesis test.
In order to test if the true proportion of females at the university is equal to the proportion of men, the null and alternative hypotheses are as follows:
H0: p = 0.5; H1: p ≠ 0.5.
The test is two-tailed, and the z-test for one proportion is suitable.
The sample size considered is, n = 50.
The sampled number of females obtained by counting the number of times “Female” appears in the column “Gender” is, x = 33.
Thus, the sampled proportion of females is, p̂ = x/n = 33/50 = 0.66.
The formula for the z-test statistic is, z = (p̂ – p)/ √ [p (1 – p)/n].
Thus,
z
= (p̂ – p)/ √ [p (1 – p)/n]
= (0.66 – 0.5) / √ [(0.5) (1 – 0.5) / 50]
= (0.16) / √ (0.005)
≈ 2.263.
Thus, the value of the test statistic is 2.263.
For the two-tailed test, the P-value would be:
P-value
= P (| Z | ≥ | z |)
= P (| Z | ≥ | 2.263 |)
= P (Z ≤ –2.263) + P (Z ≥ 2.263)
= 2 P (Z ≤ –2.263)
[Since the standard normal variable, Z is symmetric about 0]
≈ 2 × 0.0118
[Using the Excel formula: =NORM.S.DIST(-2.263,TRUE), P (Z ≤ –2.263) ≈ 0.0118]
= 0.0536.
Thus, the P-value of the test is 0.0236.
The significance level, α is not specified, so it is assumed by default that, α = 0.05.
The decision rule regarding a hypothesis testing problem using the P-value is:
Reject H0 if P-value ≤ α. Otherwise fail to reject H0.
Here, P-value (≈ 0.0236) < α (= 0.05), reject the null hypothesis H0.
Thus, it can be concluded that the proportion of females at the university is not equal to the proportion of males; in other words, the proportion of females at the university is significantly different from the proportion of males at the university.
The P-value is the probability of observing sample results at least as extreme as the observed results, given that the null hypothesis is true.
In this case, the P-value of 0.0236 indicates that, if the proportion of females at the university is indeed equal to the proportion of males (as assumed in the null hypothesis), then the probability of observing at least as extreme as 33 females in a sample of 50 randomly selected students would be only 0.0236.
In other words, if several samples of 50 students from the university are selected randomly, then only about 0.0236 proportion (or, 2.36%) of the sample will have at least as extreme as 33 female students.
3) What are the proportions of females and males at StatCrunch U?
-
- Show that the conditions are met for the use of a normal model for a confidence interval (count of successes and failures are greater than 10, as in 2 a).
- Determine a
range of plausible values for this proportion by using your choice of technology. Document your methods below, using screen short from the calculator or other technology as needed. - Interpret your interval referring to females at StatCrunchU.
- Explain what is meant by "95% confident."


Trending now
This is a popular solution!

Step by step
Solved in 5 steps with 6 images

Does your confidence interval support your hypothesis test? Explain your reasoning in detail.


