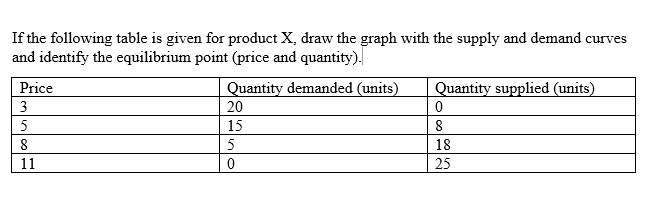
If the following table is given for product X, draw the graph with the supply and demand curves and identify the equilibrium point (price and quantity). Price Quantity demanded (units) Quantity supplied (units) 3 20 5 15 8 5 18 11 25
If the following table is given for product X, draw the graph with the supply and demand curves and identify the equilibrium point (price and quantity). Price Quantity demanded (units) Quantity supplied (units) 3 20 5 15 8 5 18 11 25

Chapter20: Elasticity: Demand And Supply
Section: Chapter Questions
Problem 13E: Using the following equation for the demand for a good or service, calculate the price elasticity of...

Related questions
Question
Transcribed Image Text:If the following table is given for product X, draw the graph with the supply and demand curves
and identify the equilibrium point (price and quantity).
Price
Quantity demanded (units)
Quantity supplied (units)
3
20
15
8
8
5
18
11
25
Expert Solution
This question has been solved!
Explore an expertly crafted, step-by-step solution for a thorough understanding of key concepts.

Step by step
Solved in 2 steps with 1 images

Knowledge Booster


Learn more about
Need a deep-dive on the concept behind this application? Look no further. Learn more about this topic, economics and related others by exploring similar questions and additional content below.Recommended textbooks for you


Economics (MindTap Course List)
Economics
ISBN:
9781337617383
Author:
Roger A. Arnold
Publisher:
Cengage Learning

