If your answer is "zero" enter a. Develop a crosstabulation for the data, with as the row variable and y as the column variable. x x A B x с Total A b. Compute the row percentages (to 1 decimal). B C A B 1 с Total Y 1 Y % % % 2 % % % c. Compute the column percentages (to 1 decimal). % Y 2 Total 2 % % % % % % Total % % % % d. Describe the observed relationship between variables and y. Category values for care Select your answer - associated with category 1 values for y.
If your answer is "zero" enter a. Develop a crosstabulation for the data, with as the row variable and y as the column variable. x x A B x с Total A b. Compute the row percentages (to 1 decimal). B C A B 1 с Total Y 1 Y % % % 2 % % % c. Compute the column percentages (to 1 decimal). % Y 2 Total 2 % % % % % % Total % % % % d. Describe the observed relationship between variables and y. Category values for care Select your answer - associated with category 1 values for y.

Algebra & Trigonometry with Analytic Geometry
13th Edition
ISBN:9781133382119
Author:Swokowski
Publisher:Swokowski
Chapter9: Systems Of Equations And Inequalities
Section9.6: The Algebra Of Matrices
Problem 9E

Related questions
Question
The following data are for 30 observations involving two categorical variables, x and y . The categories for x are A, B, and C; the categories for y are 1 and 2.
| Observation | x | y | Observation | x | y | |
| 1 | A | 1 | 16 | C | 1 | |
| 2 | C | 2 | 17 | B | 2 | |
| 3 | C | 2 | 18 | C | 2 | |
| 4 | B | 1 | 19 | B | 2 | |
| 5 | C | 2 | 20 | C | 2 | |
| 6 | B | 1 | 21 | B | 1 | |
| 7 | C | 2 | 22 | C | 2 | |
| 8 | B | 1 | 23 | B | 1 | |
| 9 | A | 1 | 24 | A | 1 | |
| 10 | C | 2 | 25 | C | 2 | |
| 11 | A | 2 | 26 | B | 1 | |
| 12 | C | 2 | 27 | B | 1 | |
| 13 | B | 1 | 28 | A | 1 | |
| 14 | B | 1 | 29 | C | 2 | |
| 15 | B | 1 | 30 | C | 1 |
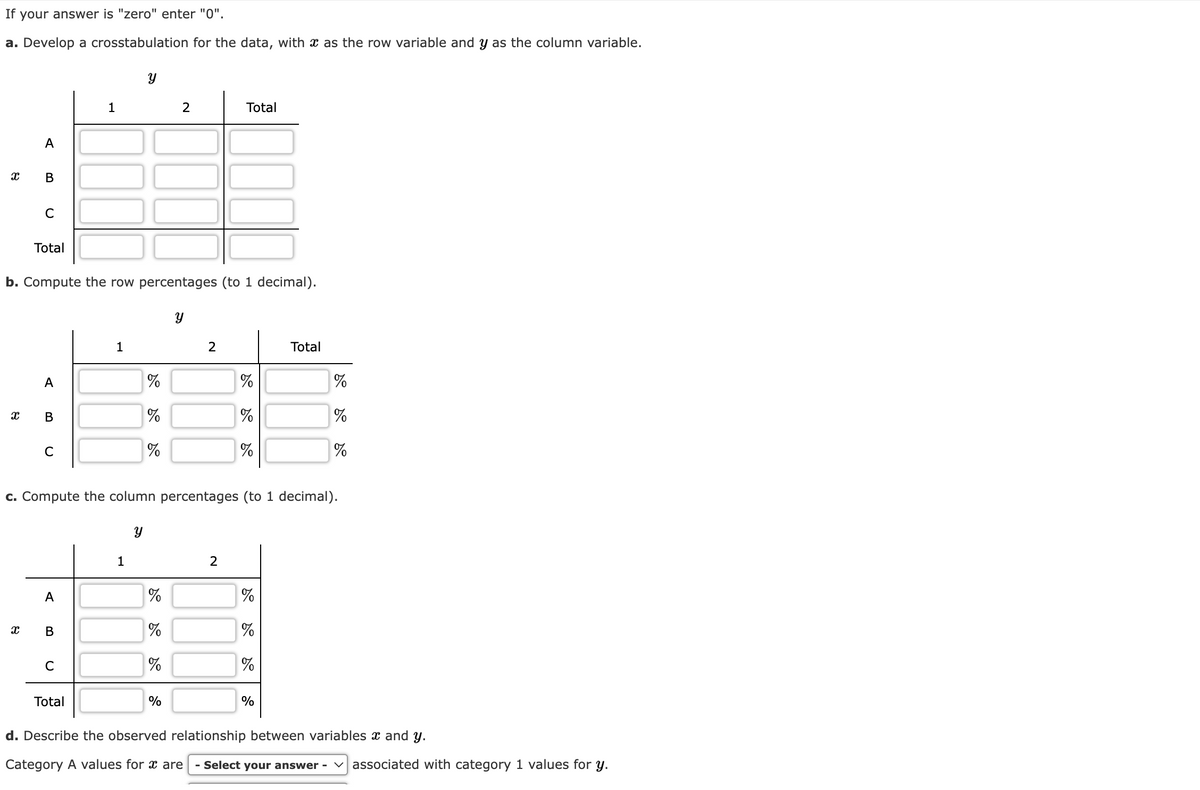
Transcribed Image Text:If your answer is "zero" enter "0".
a. Develop a crosstabulation for the data, with x as the row variable and y as the column variable.
X
A
X
B
C
Total
A
B
1
b. Compute the row percentages (to 1 decimal).
C
Y
1
2
%
%
%
2
Total
%
%
%
2
%
do do
c. Compute the column percentages (to 1 decimal).
%
Total
Y
1
A
%
#
B
%
C
%
Total
%
d. Describe the observed relationship between variables and y.
Category A values for x are - Select your answer - ✓associated with category 1 values for y.
%
%
%
do do
%
%
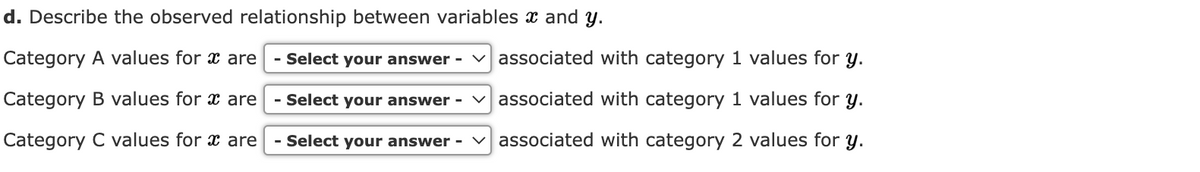
Transcribed Image Text:d. Describe the observed relationship between variables and y.
Category A values for x are - Select your answer - ✓associated with category 1 values for y.
Category B values for x are - Select your answer ✓associated with category 1 values for y.
Category C values for x are - Select your answer - associated with category 2 values for y.
Expert Solution
This question has been solved!
Explore an expertly crafted, step-by-step solution for a thorough understanding of key concepts.

This is a popular solution!

Trending now
This is a popular solution!

Step by step
Solved in 4 steps

Recommended textbooks for you
Algebra & Trigonometry with Analytic Geometry
Algebra
ISBN:
9781133382119
Author:
Swokowski
Publisher:
Cengage

Trigonometry (MindTap Course List)
Trigonometry
ISBN:
9781337278461
Author:
Ron Larson
Publisher:
Cengage Learning
Algebra & Trigonometry with Analytic Geometry
Algebra
ISBN:
9781133382119
Author:
Swokowski
Publisher:
Cengage
Trigonometry (MindTap Course List)
Trigonometry
ISBN:
9781337278461
Author:
Ron Larson
Publisher:
Cengage Learning