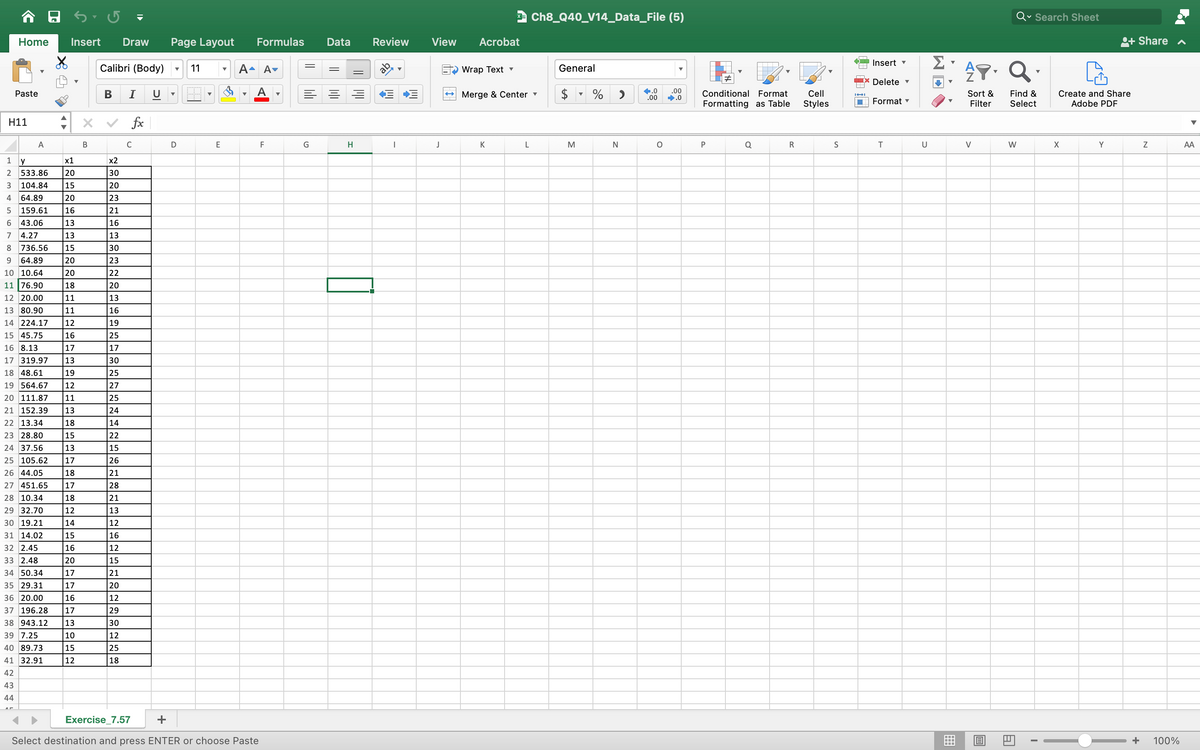
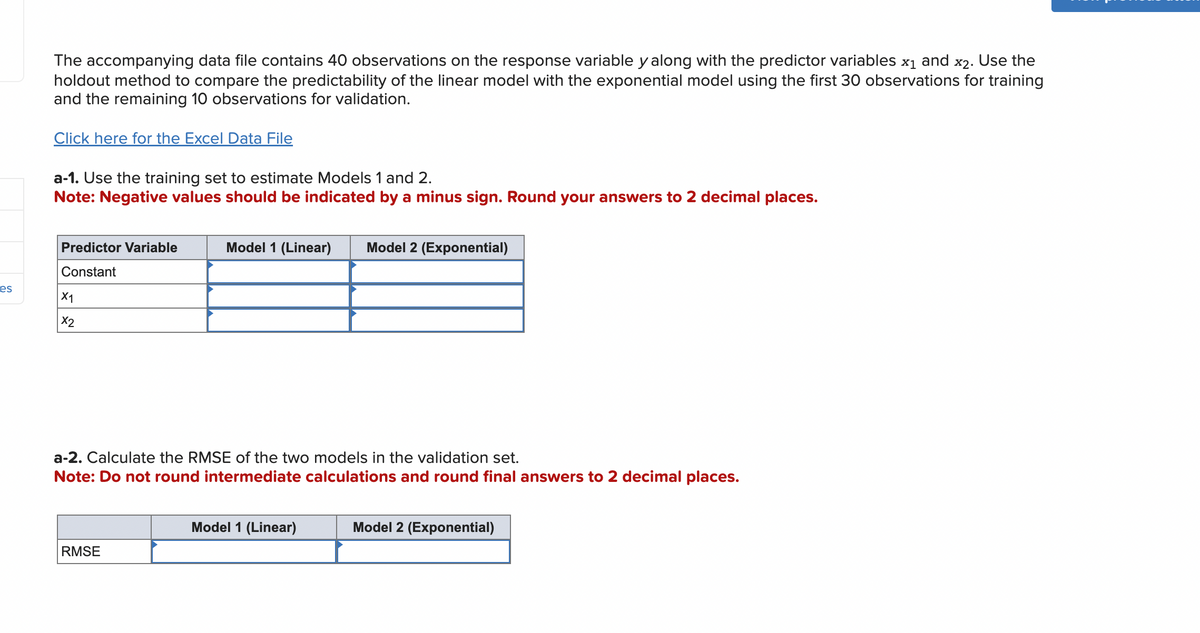
The accompanying data file contains 40 observations on the response variable y along with the predictor variables x₁ and x2. Use the holdout method to compare the predictability of the linear model with the exponential model using the first 30 observations for training and the remaining 10 observations for validation. Click here for the Excel Data File a-1. Use the training set to estimate Models 1 and 2. Note: Negative values should be indicated by a minus sign. Round your answers to 2 decimal places. Predictor Variable Constant Model 1 (Linear) Model 2 (Exponential)
Q: The error involved in making a certain measurement is a continuous rv X with the following cdf. 0…
A: As per our guidelines we are supposed to answer only 3 sub-parts of any questions so i am solving…
Q: The accompanying data set lists diastolic blood pressure measurements (mm Hg) of females. All of the…
A:
Q: The number of chocolate chips in a bag of chocolate chip cookies is approximately normally…
A:
Q: 1.3. Complete the cell with an expression that evaluates to the chance that the number of successes…
A: Given: Sample size n=100 Probability of success p=0.26
Q: A superdepartment store manager has ordered a shipment of 100 fans, 5% of which are broken. The…
A: The given information is that in a shipment of 100 fans, 5% are broken. Out of the population of…
Q: 17. The diameter of electric cable, say X, is assumed to be a continuous random variable with pdf:…
A: Given f(x)=kx(1-x) ; 0≤x<1
Q: Suppose that the walking step links of adult males are normally distributed with a mean of 2.7' and…
A: Given data,normal distribution ,μ = 2.7σ = 0.5a sample of 66 man's step lenghts is taken…
Q: Consider the following ordered data. 6 9 9 10 11 11 12 13 14 Find the low, Q1,…
A: From the provided information, The number of observations (n) = 9
Q: A simple random sample of 800 elements generates a sample proportion p = 0.69. (Round your…
A: Given,p=0.69n=8001-p=1-0.69=0.31α=1-0.95=0.05α2=0.025Z0.025=1.96
Q: A community college employs 87 full-time faculty members. To gain the faculty's opinions about an…
A: Given Information: A community college employs 87 full-time faculty members. They are numbered from…
Q: R5.29. Tableware Nambe Mills manufactures plates, bowls, and other tableware made from an alloy of…
A: From the provided output, it is interpreted that: R-squared (i.e., coefficient of variation) =…
Q: in the data set are positioned relative to each other. (B) A larger variance implies more values in…
A: Hint: Variance tells us how much data values are on average deviated from the central value(Mean).…
Q: Deep Water Financial of Duluth, Minnesota, has asked you to evaluate the stock price growth for a…
A: Deep Water Financial of Duluth, Minnesota, has asked you to evaluate the stock price growth for a…
Q: Time left 0:24:11 The item refers to the Table below which shows the scores obtained by ten students…
A:
Q: 2. (Use Slovin's Formula) A researcher would like to survey 3,000 college students for his/her…
A: Given that N=3000 99% precise Then we have to find number of students to be considered:
Q: In each situation, indicate the explanatory variable and the response variable. (1) Does meditation…
A: The question is about types of variable Introduction : There are two types of variable Explanatory…
Q: Karl and Leonard want to make soup. In order to get the right balance of ingredients for their…
A: Given: 3 pounds potatoes at $3.58 per pound 5 pounds cod at $4.71 per pound 2 pounds fish broth at…
Q: The data table to the right represents the volumes of a generic soda brand. Complete parts (a) and…
A: The given data table represents the volumes of a generic soda brand.
Q: Assume that the ages for first marriages are normally distributed with a mean of 26 years and a…
A:
Q: Travel Agency A travel agency tracks the monthly rain totals of a popular travel location to best…
A: M4 Accounts for 9 more inches of rain than M1 The rain total for M2 and M5 combined equals the…
Q: Match these values of r with the accompanying scatterplots: 0.402, 0.736,-0.736, -1, and 1. Click…
A: Introduction Scatter plots are the graphs that shows the relationship between the two variables.
Q: The data given below show the number of overtime hours worked in one week per employee. Overtime…
A: Given: Overtime hours. Employees. 0 7 1 13 2 31 3 56 4 42 5 27 6 17
Q: A cellular phone company monitors monthly phone usage. The following data represent the monthly…
A: Given: Sample size n = 20 Formula Used: Sample standard deviation s = ∑Xi-X2n-1 Interquartile range…
Q: Construct a confidence interval for P₁ P2 at the given level of confidence. x₁ =397, n₁ = 523, Xx2 =…
A: It is given that, For the first sample: x1 (no. of sample elements with some defined…
Q: A defunct website listed the "average" annual income for Florida as $35,031. What is the role of…
A: Descriptive Statistics: The assessment, summation, and findings of the research pertaining to…
Q: Walmarts 2016 sales were about $481 billion. Suppose sales are projected to increase at a rate of…
A:
Q: Define random variations?
A: The question is about time series analysis Introduction : Time Series : It is a statistical…
Q: mammal is the Kitti's hog-nosed bat, with a mean weight of 1.5 grams and a standard deviation of…
A: given data μ = 1.5 σ = 0.25 normal distribution
Q: A study was done comparing the effectiveness of exercise vs medication on lowering blood pressure in…
A: Introduction An experiment is a procedure which can be repeated infinitely and has a well-defined…
Q: Find the sample space of the following two-stage experiment: First select an SCC student randomly…
A: two stage experiment first record the gender if student is male ask him whether his last assignment…
Q: The data represent the age of world leaders on their day of inauguration. Find the five-number…
A: Arrange the data in ascending order as follows: Data 47 48 49 56 58 62 64 Total…
Q: What is the mode in the graph below? 600- 500- 400- 300 200- Frequency
A: Given data,here frequency distribution graph is given .we have find out the mode of the graph here…
Q: The article “Study on the Life Distribution of Microdrills” (J. of Engr. Manufacture, 2002: 301–…
A: Given data indicates the drill lifetime (number of holes that a drill machines before it breaks)…
Q: In a blind taste test, people were given four different types of water and asked to select their top…
A: It is given that, 10 participants selected tap water. 25 participants selected Aquafina. 41…
Q: it possible to write two numbers diffrent from those found with mean 8 and variance 4
A: Concept: mean is the average value And standard deviation is the deviation of data points from mean…
Q: Now suppose that you suffer from confirmation bias. You are pretty sure that it is going to be…
A: Hint: Use Baye's theorem to get the posterior probability. Then find the expected payoff using the…
Q: Explain random numbers?
A: Introduction A no. in mathematics and statistics is an object which is used for counting, measuring…
Q: 4 ASK YOUR TEACHER Let Z be a standard normal random variable and calculate the following…
A:
Q: Given the following data in measuring a distance of a certain line. DISTANCE 740.53 740.59 740.57…
A: Given data: Distance No. of Measurements 740.53 4 740.59 3 740.57 6 740.53 7 Total 20…
Q: A weather forecaster predicts that the May rainfall in a local area will be between 1 and 7 inches…
A: given data x = amount of may rain fall X~U(1,7) uniform distribution S.D.(σ)x = ?
Q: is 6% is your standard deviation?
A: Given according to question Sample size(N)=? Confidence =95% Margin of error = 5% Now question says…
Q: Let Z be a standard normal random variable and calculate the following probabilities, drawing…
A:
Q: Someone interested in the number of miles Prof. St. John has run each day preparing for her next…
A:
Q: The president uses technology to produce the following random numbers. 50 61 79 49 54 61…
A: Given: The president uses technology to produce the following random numbers. 50 61 79 49…
Q: In the toss of three dice, what is the probability of obtaining 2 twos and 1 four? Please answer…
A: Answer:- Given, three dice are tossed, what is the probability of obtaining 2 twos…
Q: In 2002, the average duration of incoming telephone calls to a furniture store was 9.4minutes. The…
A: The claimed average duration (in minutes) of incoming calls is 9.4 minutes. Of the 20 randomly…
Q: (A) Variance relates to how the values in the data set are positioned relative to each other. (B) A…
A: Variance is the measure of dispersion. It measure the squared difference of each observation from…
Q: (A) The population [N] and the sample [n] are similar in that they should be comprised of people…
A: A population is a set of all items or individuals of interest. It contains all members of a specific…
Q: a. Construct a stem-and-leaf display based on repeat- ing each stem value twice, and comment on…
A: From give date we have sample : 16 18 18 26 33 41 54 56 66 68 87 91 95 98 106 109 111 118 127 127…
Q: Find the sample variance and standard deviation. 6, 47, 11,
A: Given data : 6, 47, 11, 49, 38, 22, 31, 31, 31, 27
Trending now
This is a popular solution!
Step by step
Solved in 2 steps with 2 images
- ID Manufacturer Engine Type Engine Type (0=diesel) Capacity Maintenance cost Age Odometer Miles Miles traveled since the last maintenance 10 Keiser Gasoline 1 14 4646 5 54375 10417 396 Thompson Diesel 0 14 1072 2 21858 10851 122 Bluebird Gasoline 1 55 9394 10 116580 10426 751 Keiser Diesel 0 14 1078 2 22444 11894 279 Bluebird Diesel 0 55 1008 2 22672 10106 500 Bluebird Gasoline 1 55 5329 5 50765 11880 520 Bluebird Diesel 0 55 4794 10 119130 11581 759 Keiser Diesel 0 55 3952 8 87872 10758 714 Bluebird Diesel 0 42 3742 7 73703 10854 875 Bluebird Diesel 0 55 4376 9 97947 11527 600 Bluebird Diesel 0 55 4832 10 119860 11614 953 Bluebird Diesel 0 55 5160 10 117700 11143 101 Bluebird Diesel 0 55 1955 4 41096 10614 358 Bluebird Diesel 0 55 2775 6 70086 9956 29 Bluebird Gasoline 1 55 5352 6 69438 10070 365 Keiser Diesel 0 55 3065 6 63384 11024 162 Keiser Gasoline 1 55 3143 3 31266 10236 686 Bluebird Diesel 0 55 1569 3 34674 11465 370 Keiser Gasoline 1 55…ID Manufacturer Engine Type Engine Type (0=diesel) Capacity Maintenance cost Age Odometer Miles Miles traveled since the last maintenance 10 Keiser Gasoline 1 14 4646 5 54375 10417 396 Thompson Diesel 0 14 1072 2 21858 10851 122 Bluebird Gasoline 1 55 9394 10 116580 10426 751 Keiser Diesel 0 14 1078 2 22444 11894 279 Bluebird Diesel 0 55 1008 2 22672 10106 500 Bluebird Gasoline 1 55 5329 5 50765 11880 520 Bluebird Diesel 0 55 4794 10 119130 11581 759 Keiser Diesel 0 55 3952 8 87872 10758 714 Bluebird Diesel 0 42 3742 7 73703 10854 875 Bluebird Diesel 0 55 4376 9 97947 11527 600 Bluebird Diesel 0 55 4832 10 119860 11614 953 Bluebird Diesel 0 55 5160 10 117700 11143 101 Bluebird Diesel 0 55 1955 4 41096 10614 358 Bluebird Diesel 0 55 2775 6 70086 9956 29 Bluebird Gasoline 1 55 5352 6 69438 10070 365 Keiser Diesel 0 55 3065 6 63384 11024 162 Keiser Gasoline 1 55 3143 3 31266 10236 686 Bluebird Diesel 0 55 1569 3 34674 11465 370 Keiser Gasoline 1 55…Assignment Miles Gasoline Consumption Deliveries Time 1 100.0 10.0 4.0 9.3 2 50.0 6.2 3.0 4.8 3 100.0 9.5 4.0 8.9 4 100.0 10.3 2.0 6.5 5 50.0 4.7 2.0 4.2 6 80.0 7.8 2.0 6.2 7 75.0 7.7 3.0 7.4 8 65.0 6.4 4.0 6.0 9 90.0 8.8 3.0 7.6 10 90.0 10.0 2.0 6.1 11 50.0 5.0 5.0 7.0 12 45.0 4.9 6.0 7.0 13 85.0 8.1 5.0 9.6 14 65.0 6.6 2.0 6.5 15 40.0 4.0 6.0 7.2 16 50.0 5.5 3.0 6.0 17 75.0 7.4 5.0 9.9 18 75.0 7.6 4.0 8.6 19 65.0 6.8 3.0 4.9 20 90.0 8.4 3.0 7.5 21 95.0 8.8 1.0 7.2 22 95.0 10.2 6.0 9.9 23 50.0 4.6 1.0 5.6 24 80.0 8.6 3.0 7.5 25 90.0 8.6 2.0 7.8 26 80.0 8.8 3.0 7.2 27 75.0 6.9 3.0 7.0 28 95.0 10.0 2.0 8.7 29 90.0 9.2 1.0 6.4 30 100.0 9.4 3.0 9.9 31 60.0 6.0 1.0 4.1 32 90.0 9.8 4.0 9.3 33 70.0 6.8 5.0 9.1 34 100.0 9.4 5.0 8.9 35 40.0 4.9 4.0 5.4 36 80.0 7.5 2.0 5.9 37 90.0 9.4 4.0 8.8 38 80.0 8.6 5.0 8.4 39 95.0 8.6 2.0 9.4 40 75.0 8.0 5.0 8.8 41 40.0 3.8 3.0 5.0 42 45.0 5.7 3.0 6.5 43 75.0 7.9 6.0 8.7…
- WAGE EDUC EXPER AGE GENDER RACE 1345 6 2 38 0 1 2435 4 18 52 1 1 1715 6 4 45 1 1 1461 6 4 58 1 1 1639 9 3 30 1 0 1345 5 8 43 0 1 1602 7 6 30 0 1 1144 4 3 33 0 0 1566 6 23 51 1 0 1496 4 15 37 1 1 1234 4 9 45 0 0 1345 6 3 55 0 1 1345 5 14 57 0 1 3389 9 16 36 1 1 1839 4 20 60 1 1 981 4 5 35 1 0 1345 9 10 34 0 1 1566 5 4 28 0 0 1187 6 1 25 0 1 1345 7 10 43 0 1 1345 9 2 42 0 1 2167 4 17 47 1 0 1402 11 2 46 1 1 2115 4 15 52 1 0 2218 8 11 64 1 1 3575 11 1 39 1 1 1972 4 1 39 1 1 1234 4 2 40 0 1 1926 5 9 53 1 0 2165 6 15 59 0 1 2365 6 12 35 0 0 1345 9 5 45 0 1 1839 4 14 37 0 0 2613 5 14 37 1 1 2533 11 3 43 1 1 1602 8 5 32 0 1 1839 9 18 40 0 1 2218 7 1 49 1 1 1529 4 10 43 0 0 1461 1 10 31 1 0 3307 9 22 45 1 1 3833 11 3 31 1 1 1839 4 14 55 1 0 1461 6 5 30 0 1 1433 9 3 28 1 0 2115 6 15 60 0 0 1839 4 13 32 1 0 1288 4 9 58 1 0 1288 6 4 29 0 0Value Added by Mfg. Cost of Materials 23518 78713 15724 42774 24506 27222 21667 37040 20712 12030 12640 13674 4258 19130 35210 33521 20548 19612 23442 5557 287 163 1508 314 624 2622 2471 4219 4307 5357 673 1061 817 707 8986 10421 3145 4140 4076 7125 3806 8994 4276 5504 1239 716 9423 8926 11045 11121 1916 2283 599 364 2063 1813 34 71 1445 1321 10603 12376 5775 9661 10404 19285 13274 18632 1909 2170 4606 7290 5518 8135 12464 12980 5447 4011 2290 5101 4182 3755 2818 2694 2201 3279 18848 20596 9655 10604 15668 24634 25918 28963 30692 8483 17982 6940 17857 8863 9699 2823 38407 29572 3878 3811 3989 1047 4388 2055 4055 1098 16567 11298 25025 34596 59813 27187 31801 19932 8497 9849 28886 46935 12277 11130 11547 13085 26006 132880 3464 6182 2187 4446 7079 7091 442 496 4528 3805 7275 7195 55621 57264 1313 1865 162 163 1907 1682 53 85 747 395…An urgent care center has two campuses, A and B. The doctors at the two campuses are comparing the wait time in minutes for customers. The amount of time was measured for each patient at both campuses. The results are provided in the table below. Campus A Campus B 99 2424 1515 1111 2121 1414 1919 1313 3030 2222 3131 55 1616 1111 2727 1717 1919 2121 77 1717 2222 2626 2828 2424 2121 1818 44 3737 3333 88 Justify the measure of center and measure of spread that could be used to compare the two data sets. The median and interquartile range could be used because the distribution for Campus A is skewed right with an outlier of 3030 minutes, and the distribution for Campus B is roughly symmetric with no outliers. The median and interquartile range could be used. Although there are no outliers, the distribution for Campus A is skewed left, and the distribution for Campus B is skewed right. The mean and standard deviation could be used. Both of the…
- STUDENT ID HEIGHT (m) WEIGHT (kg) AGE 221063641 1.65 60 18 221026045 1.45 41 17 220050244 1.71 65 18 221082107 1.55 45 17 221003142 1.57 53 19 221137823 1.68 64 18 221056904 1.60 52 20 221051686 1.64 60 21 221009965 1.68 58 22 221120580 1.50 64 21 221007148 1.65 56 22 221139850 1.55 56 20 220036489 1.65 54 20 221067817 1.68 60 21 221047220 1.79 65 18 220040028 1.70 61 18 221010386 1.50 51 18 221079017 1.65 50 19 220040028 1.56 56 19 221078673 1.65 65 21 219060045 1.68 68 21 220049408 1.66 65 19 21915970 1.56 56 19 220090246 1.65 60 19 220119066 1.73 68 21 219057222 1.58 58 19 220119287 1.65 65 18 220076499 1.78 65 19 220119805 1.68 68 19 Question 1 Use graphical descriptive techniques (Pie…Café Michigan's manager, Gary Stark, suspects that demand for mocha latte coffees depends on the price being charged. Based on historical observations, Gary has gathered the following data, which show the numbers of these coffees sold over six different price values: Price Number Sold $2.702.70 770770 $3.503.50 515515 $2.002.00 980980 $4.104.10 240240 $3.203.20 320320 $4.054.05 475475 Expain the steps for usingsimple linear regression and given that the price per cup is $1.75, the forecasted demand for mocha latte coffees will be how many cups?Timestamp How Long Do You Sleep?2023/06/19 9:22:59 AM GMT+8 7 Hours2023/06/19 9:27:20 AM GMT+8 10 hours2023/06/19 9:27:33 AM GMT+8 7 Hours2023/06/19 9:27:58 AM GMT+8 4 Hours2023/06/19 9:29:42 AM GMT+8 7 Hours2023/06/19 9:35:06 AM GMT+8 5 Hours2023/06/19 9:38:05 AM GMT+8 7 Hours2023/06/19 9:38:23 AM GMT+8 7 Hours2023/06/19 11:25:53 AM GMT+8 7 Hours2023/06/19 3:29:53 PM GMT+8 7 Hours2023/06/19 3:30:01 PM GMT+8 7 Hours2023/06/19 3:30:09 PM GMT+8 7 Hours2023/06/19 3:30:21 PM GMT+8 7 Hours2023/06/19 3:30:23 PM GMT+8 7 Hours2023/06/19 3:30:28 PM GMT+8 7 Hours2023/06/19 3:30:31 PM GMT+8 7 Hours2023/06/19 3:30:37 PM GMT+8 7 Hours2023/06/19 3:30:38 PM GMT+8 7 Hours2023/06/19 3:30:43 PM GMT+8 7 Hours2023/06/19 3:30:44 PM GMT+8 7 Hours2023/06/19 3:30:49 PM GMT+8 7 Hours2023/06/19 3:30:51 PM GMT+8 7 Hours2023/06/19 3:30:56 PM GMT+8 7 Hours2023/06/19 3:31:00 PM GMT+8 7 Hours2023/06/19 3:31:06 PM GMT+8 7 Hours2023/06/19…
- 214.26 356.79 424.96 231.51 353.89 552.75 281.93 303.66 518.15 234.62 336.36 514.07 246.55 341.26 575.65 277.97 452.59 652.23 267.33 482.71 775.82 209.67 445.44 769.54 372.05 428.84 765.86 320.02 485.78 819.89. The table below contains the total cost ($) for four tickets to a basketball game purchased on the secondary market, two beers, two soft drinks, two hot dogs, and one parking space at each arena during a recent season. a. Organize these costs as an ordered array. b. Construct a frequency distribution and a percentage distribution for these costs. c. Around what values, if any, are at least 75% of the costs of attending the game concentrated? Explain. Question content area bottom Part 1 a. Organize these costs as an ordered array. enter your response here enter your response here enter your response here enter your response here enter your response here enter your response here enter your response here enter your response here enter your…R-Studio or by hand. Thank you! Data: TSERofReturn AcmeRofReturn 1 0.42478 -0.48194 2 1.61213 -0.73284 3 -0.98754 -2.28445 4 -0.30013 -1.55312 5 1.41215 0.68674 6 0.68725 -1.31132 7 0.03733 -0.83295 8 -1.72494 -1.71975 9 0.33729 1.14443 10 -1.07502 -1.79885 11 0.86222 0.89736 12 1.17468 1.66664 13 -0.38761 -0.02658 14 1.66212 0.9086 15 1.09969 1.99935 16 -0.06266 0.46148 17 -1.96241 -1.41004 18 -1.32499 -0.38086 19 -1.51247 -1.90904 20 0.74974 0.91873 21 -0.38761 -0.49714 22 -0.17514 -1.31385 23 -3.41222 -1.15681 24 -0.01266 2.11718 25 0.16231 1.78766 26 -0.82506 1.30344 27 -0.41261 -0.43377 28 0.2623 -1.70274 29 -1.16251 0.4692 30 -1.05003 0.27671 31 -0.65008 -0.63741 32 0.62475 2.9895 33 -0.68758 1.3613 34…