Ihe heights and weight of six men are given belaw. given SX men Heightlmetes) koeght(kgs) 1.80/185 78.0 1.72 1.75 1:79 80-0 7401750 76.0 2.00 85.0 ) Determine the lines of regression of Herght on weighte an weight on height


Correlation
Correlation defines a relationship between two independent variables. It tells the degree to which variables move in relation to each other. When two sets of data are related to each other, there is a correlation between them.
Linear Correlation
A correlation is used to determine the relationships between numerical and categorical variables. In other words, it is an indicator of how things are connected to one another. The correlation analysis is the study of how variables are related.
Regression Analysis
Regression analysis is a statistical method in which it estimates the relationship between a dependent variable and one or more independent variable. In simple terms dependent variable is called as outcome variable and independent variable is called as predictors. Regression analysis is one of the methods to find the trends in data. The independent variable used in Regression analysis is named Predictor variable. It offers data of an associated dependent variable regarding a particular outcome.

Hey, since there are multiple subparts posted, we will answer first three subparts. If you want any specific subpart to be answered then please submit that subpart only or specify the subpart in your message.
1)
Regression for heights on weight
Software procedure for regression in EXCEL.
- Enter the given data in EXCEL sheet.
- Go to Data > Data Analysis > Regression.
- Select heights and weights column as ranges of y and x
- Select Labels check box.
- Click OK.
Excel output:
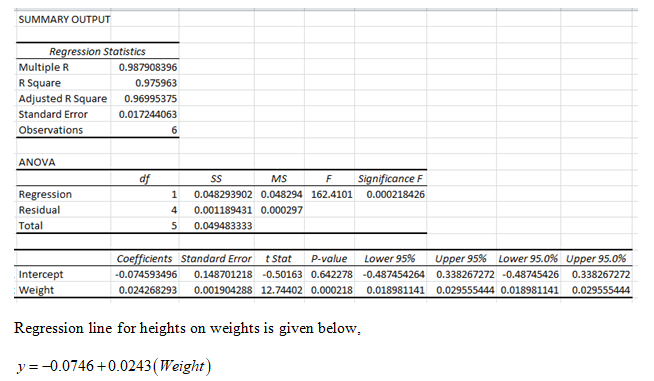

Step by step
Solved in 4 steps with 3 images


