← Quantitative Analytics BUS260 C chegg.com/homework-help/qu X Answered: ^^QG... | bartle My first project - MyBib + → C n qmplus.qmul.ac.uk/pluginfile.php/3569556/mod_resource/content/2/BUS260_Week10.pdf Quantitative Analytics - BUS260 - Forecasting 1 - Week 10 24 25 26 27 Exponential thing-Excel -52 FTSE 250 +0.70% 28 Q Search 28 / 28 172% + BUS260 - School of Business and Management 27/28 Exponential Smoothing - Excel Step 2 A B D E F G H 1 J K 1 Optimal Smoothing Constant (a) Q ✩ វា ☐ 2 3 α 0.1 Data Table for Replication for each smoothing constant 4 5 Period Demand Forecast Error² a 6 1 42 MSE 2.4141 Mean Squared Error 7 2 40 42 4 8 3 43 41.8 9 4 40 10 5 41 11 41.92 41.728 MSE 1.44 3.6864 0.529984 2.414096 12 0.05 2.44173 0.1 2.4141 0.15 2.41351 0.2 2.4371 0.25 2.48267 0.3 2.54856 4 13 0.35 2.63368 14 0.4 2.73738 15 16 17 18 2 8 རྞ ཀྵུ རྞ ཀྵུ 0.45 0.5 0.55 3.15967 0.6 3.33938 0.65 3.54043 2.85942 0 0.7 3.76456 0.05 0.1 0.15 0.2 0.25 0.3 0.35 0.4 0.45 0.5 0.55 0.6 0.65 0.7 0.75 0.8 0.85 0.9 0.95 Smoothing constant (a) 0.75 4.01392 0.8 4.2911 0.85 4.59926 0.9 4.9421 0.95 5.32398 BUS260- School of Business and Management 28/28 to. > | 0 ✓ I New Chrome available: 11:15 12/04/2024 PRE III Quantitative Analytics - BUS260 C chegg.com/homework-help/qu b Answered: ^^^ G... | bartle X My first project - MyBib × + qmplus.qmul.ac.uk/pluginfile.php/3569556/mod_resource/content/2/BUS260_Week10.pdf Quantitative Analytics - BUS260 - Forecasting 1 - Week 10 20 21 24 / 28 156% + | 0 ☑ Q ✩ New Chrome available: Repeating sequentially the same argument, we obtain Ft= = aАt−1+α(1−a)At−2+a(1-a)² At−3+a(1−a)³At−4+…… BUS260- School of Business and Management 23/28 Exponential Smoothing - Example 2 Period t α t-1 a(1-a) Weight 0.2 0.16 0.4 0.24 t-2 a(1-a)² 0.128 22 t-3 a(1-a)³ t-4 a(1-a)4 0.1024 0.08192 0.144 0.0864 0.05184 0.45 0.4 0.35 t-5 a(1-a)5 0.065536 0.031104 0.3 t-6 a(1-a)6 0.052429 0.018662 t-7 a(1-a)' 0.041943 0.011197 t-8 a(1-a)8 Weights 0.25 0.2 0.033554 0.006718 0.15 t-9 a(1-a)⁹ 0.026844 0.004031 t-10 a(1-α) 10 0.1 0.021475 0.002419 t-11 a(1-a)¹¹ 23 t-12 a(1-a) 12 t-13 a(1-a) 13 t-14 a(1-a) 14 t-15 a(1-a) 15 t-16 a(1-a)16 t-17 a(1-a) 17 0.01718 0.001451 0.013744 0.000871 0.010995 0.000522 0.008796 0.000313 0.007037 0.000188 0.005629 0.000113 0.004504 6.77E-05 0.05 0 t-18 a(1-a) 18 0.003603 4.06E-05 t-19 a(1-a) 19 0.002882 2.44E-05 t-20 a(1-a) 20 0.002306 1.46E-05 FTSE 250 24 +0.70% Ő Search Exponential weights -a-0.2-a-0.4 t t-1 t-2 t-3 t-4 t-5 t-6 t-7 t-8 t-9 t-10t-11t-12t-13t-14t-15t-16t-17t-18t-19-20 Period 9 0 11:14 12/04/2024 PRE

Managerial Economics: Applications, Strategies and Tactics (MindTap Course List)
14th Edition
ISBN:9781305506381
Author:James R. McGuigan, R. Charles Moyer, Frederick H.deB. Harris
Publisher:James R. McGuigan, R. Charles Moyer, Frederick H.deB. Harris
Chapter5: Business And Economic Forecasting
Section: Chapter Questions
Problem 2E
icon
Related questions
Question

hello so i just learnt about forecasting and i dont understand it all. i am not sure how to answer this questions on Excel that my teacher provided me with:

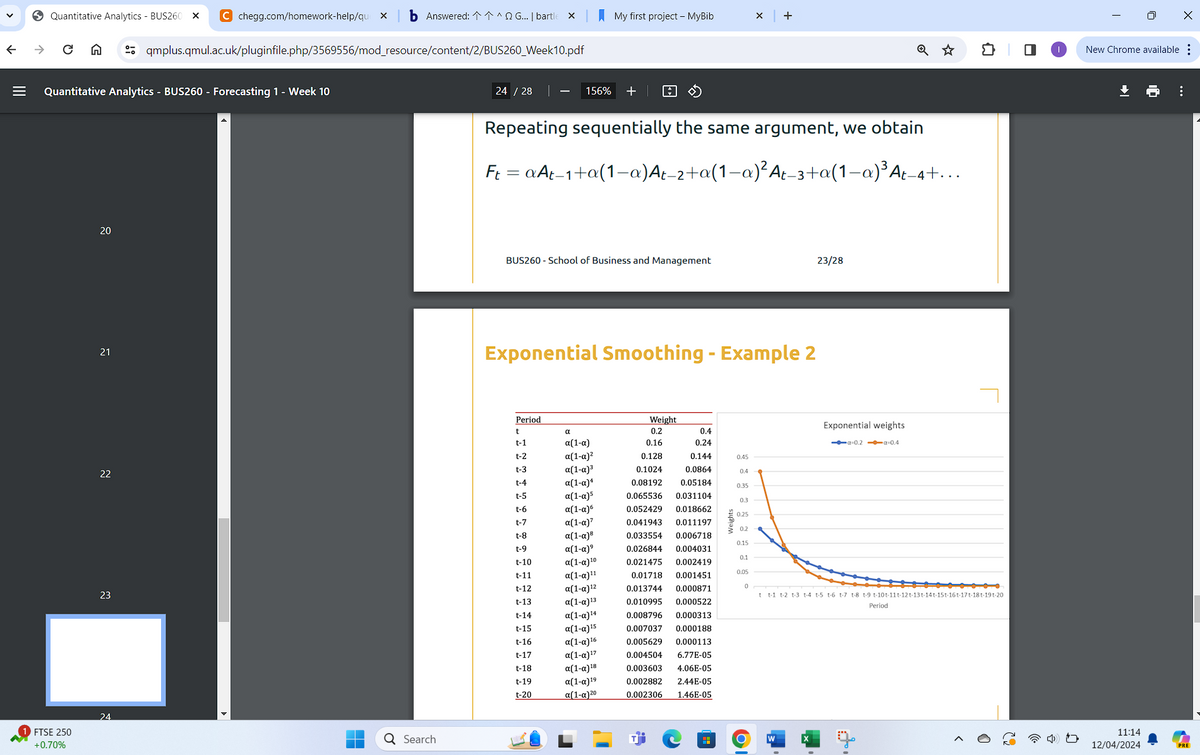
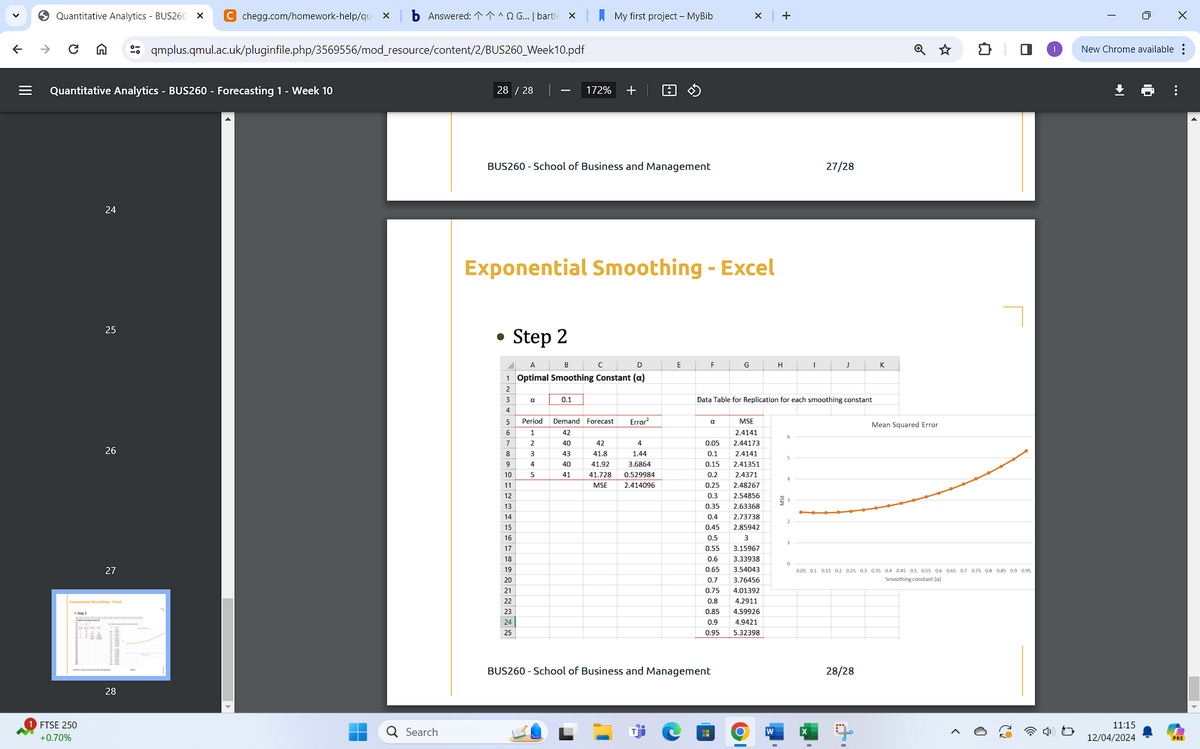
so question is about Forecasting in Picture 1 and 2 it shows what its meant to look like nothing to do with what i am gonna ask its just example but i still dont understand.

sorry for making this long i am not 100% sure if the pictures that i sent are example of what i am supposed to do for this question if you think its not just dont use it.


Here is the actual question:

Month Sales
Jan-16 747
Feb-16 697
Mar-16 1014
Apr-16 1126
May-16 1105
Jun-16 1450
Jul-16 1639
Aug-16 1711
Sep-16 1307
Oct-16 1223
Nov-16 975
Dec-16 953
Jan-17 1024
Feb-17 928
Mar-17 1442
Apr-17 1371
May-17 1536
Jun-17 2004
Jul-17 1854
Aug-17 1951
Sep-17 1516
Oct-17 1642
Nov-17 1166
Dec-17 1106
Jan-18 1189
Feb-18 1209
Mar-18 1754
Apr-18 1843
May-18 1769
Jun-18 2207
Jul-18 2471
Aug-18 2288
Sep-18 1867
Oct-18 1980
Nov-18 1418
Dec-18 1333
Jan-19 1333
Feb-19 1370
Mar-19 2142
Apr-19 2138
May-19 2078
Jun-19 2960
Jul-19 2616
Aug-19 2861
Sep-19 2237
Oct-19 2225
Nov-19 1590
Dec-19 1659
Jan-20 1613
Feb-20 1605
Mar-20 2349
Apr-20 2468
May-20 2532
Jun-20 3127
Jul-20 3288
Aug-20 3285
Sep-20 2485
Oct-20 2723
Nov-20 1835
Dec-20 1894

(This is from Excel)

using the data above answer this:

Consider five years of monthly profit for a company

A) Plot the data and discuss its properties.   Can you see any trend, seasonality or break?       

B) Forecast monthly sales for 2022 choosing an appropriate method.   

C) Discuss whether a simple exponential smoothing model works well with this data or not.
←
Quantitative Analytics BUS260
C chegg.com/homework-help/qu X
Answered: ^^QG... | bartle
My first project - MyBib
+
→
C
n
qmplus.qmul.ac.uk/pluginfile.php/3569556/mod_resource/content/2/BUS260_Week10.pdf
Quantitative Analytics - BUS260 - Forecasting 1 - Week 10
24
25
26
27
Exponential thing-Excel
-52
FTSE 250
+0.70%
28
Q Search
28 / 28
172%
+
BUS260 - School of Business and Management
27/28
Exponential Smoothing - Excel
Step 2
A
B
D
E
F
G
H
1
J
K
1 Optimal Smoothing Constant (a)
Q ✩ វា
☐
2
3
α
0.1
Data Table for Replication for each smoothing constant
4
5
Period
Demand Forecast
Error²
a
6
1
42
MSE
2.4141
Mean Squared Error
7
2
40
42
4
8
3
43
41.8
9
4
40
10
5
41
11
41.92
41.728
MSE
1.44
3.6864
0.529984
2.414096
12
0.05 2.44173
0.1 2.4141
0.15 2.41351
0.2 2.4371
0.25 2.48267
0.3 2.54856
4
13
0.35 2.63368
14
0.4 2.73738
15
16
17
18
2 8 རྞ ཀྵུ རྞ ཀྵུ
0.45
0.5
0.55 3.15967
0.6 3.33938
0.65 3.54043
2.85942
0
0.7
3.76456
0.05 0.1 0.15 0.2 0.25 0.3 0.35 0.4 0.45 0.5 0.55 0.6 0.65 0.7 0.75 0.8 0.85 0.9 0.95
Smoothing constant (a)
0.75
4.01392
0.8
4.2911
0.85
4.59926
0.9
4.9421
0.95
5.32398
BUS260- School of Business and Management
28/28
to.
>
|
0
✓
I
New Chrome available:
11:15
12/04/2024
PRE
Transcribed Image Text:← Quantitative Analytics BUS260 C chegg.com/homework-help/qu X Answered: ^^QG... | bartle My first project - MyBib + → C n qmplus.qmul.ac.uk/pluginfile.php/3569556/mod_resource/content/2/BUS260_Week10.pdf Quantitative Analytics - BUS260 - Forecasting 1 - Week 10 24 25 26 27 Exponential thing-Excel -52 FTSE 250 +0.70% 28 Q Search 28 / 28 172% + BUS260 - School of Business and Management 27/28 Exponential Smoothing - Excel Step 2 A B D E F G H 1 J K 1 Optimal Smoothing Constant (a) Q ✩ វា ☐ 2 3 α 0.1 Data Table for Replication for each smoothing constant 4 5 Period Demand Forecast Error² a 6 1 42 MSE 2.4141 Mean Squared Error 7 2 40 42 4 8 3 43 41.8 9 4 40 10 5 41 11 41.92 41.728 MSE 1.44 3.6864 0.529984 2.414096 12 0.05 2.44173 0.1 2.4141 0.15 2.41351 0.2 2.4371 0.25 2.48267 0.3 2.54856 4 13 0.35 2.63368 14 0.4 2.73738 15 16 17 18 2 8 རྞ ཀྵུ རྞ ཀྵུ 0.45 0.5 0.55 3.15967 0.6 3.33938 0.65 3.54043 2.85942 0 0.7 3.76456 0.05 0.1 0.15 0.2 0.25 0.3 0.35 0.4 0.45 0.5 0.55 0.6 0.65 0.7 0.75 0.8 0.85 0.9 0.95 Smoothing constant (a) 0.75 4.01392 0.8 4.2911 0.85 4.59926 0.9 4.9421 0.95 5.32398 BUS260- School of Business and Management 28/28 to. > | 0 ✓ I New Chrome available: 11:15 12/04/2024 PRE
III
Quantitative Analytics - BUS260
C chegg.com/homework-help/qu
b Answered: ^^^ G... | bartle X
My first project - MyBib
× +
qmplus.qmul.ac.uk/pluginfile.php/3569556/mod_resource/content/2/BUS260_Week10.pdf
Quantitative Analytics - BUS260 - Forecasting 1 - Week 10
20
21
24 / 28
156% +
|
0
☑
Q ✩
New Chrome available:
Repeating sequentially the same argument, we obtain
Ft=
=
aАt−1+α(1−a)At−2+a(1-a)² At−3+a(1−a)³At−4+……
BUS260- School of Business and Management
23/28
Exponential Smoothing - Example 2
Period
t
α
t-1
a(1-a)
Weight
0.2
0.16
0.4
0.24
t-2
a(1-a)²
0.128
22
t-3
a(1-a)³
t-4
a(1-a)4
0.1024
0.08192
0.144
0.0864
0.05184
0.45
0.4
0.35
t-5
a(1-a)5
0.065536 0.031104
0.3
t-6
a(1-a)6
0.052429 0.018662
t-7
a(1-a)'
0.041943 0.011197
t-8
a(1-a)8
Weights
0.25
0.2
0.033554
0.006718
0.15
t-9
a(1-a)⁹
0.026844 0.004031
t-10
a(1-α) 10
0.1
0.021475 0.002419
t-11
a(1-a)¹¹
23
t-12
a(1-a) 12
t-13
a(1-a) 13
t-14
a(1-a) 14
t-15
a(1-a) 15
t-16
a(1-a)16
t-17
a(1-a) 17
0.01718 0.001451
0.013744 0.000871
0.010995 0.000522
0.008796 0.000313
0.007037 0.000188
0.005629 0.000113
0.004504 6.77E-05
0.05
0
t-18
a(1-a) 18
0.003603 4.06E-05
t-19
a(1-a) 19
0.002882 2.44E-05
t-20
a(1-a) 20
0.002306
1.46E-05
FTSE 250
24
+0.70%
Ő
Search
Exponential weights
-a-0.2-a-0.4
t t-1 t-2 t-3 t-4 t-5 t-6 t-7 t-8 t-9 t-10t-11t-12t-13t-14t-15t-16t-17t-18t-19-20
Period
9
0
11:14
12/04/2024
PRE
Transcribed Image Text:III Quantitative Analytics - BUS260 C chegg.com/homework-help/qu b Answered: ^^^ G... | bartle X My first project - MyBib × + qmplus.qmul.ac.uk/pluginfile.php/3569556/mod_resource/content/2/BUS260_Week10.pdf Quantitative Analytics - BUS260 - Forecasting 1 - Week 10 20 21 24 / 28 156% + | 0 ☑ Q ✩ New Chrome available: Repeating sequentially the same argument, we obtain Ft= = aАt−1+α(1−a)At−2+a(1-a)² At−3+a(1−a)³At−4+…… BUS260- School of Business and Management 23/28 Exponential Smoothing - Example 2 Period t α t-1 a(1-a) Weight 0.2 0.16 0.4 0.24 t-2 a(1-a)² 0.128 22 t-3 a(1-a)³ t-4 a(1-a)4 0.1024 0.08192 0.144 0.0864 0.05184 0.45 0.4 0.35 t-5 a(1-a)5 0.065536 0.031104 0.3 t-6 a(1-a)6 0.052429 0.018662 t-7 a(1-a)' 0.041943 0.011197 t-8 a(1-a)8 Weights 0.25 0.2 0.033554 0.006718 0.15 t-9 a(1-a)⁹ 0.026844 0.004031 t-10 a(1-α) 10 0.1 0.021475 0.002419 t-11 a(1-a)¹¹ 23 t-12 a(1-a) 12 t-13 a(1-a) 13 t-14 a(1-a) 14 t-15 a(1-a) 15 t-16 a(1-a)16 t-17 a(1-a) 17 0.01718 0.001451 0.013744 0.000871 0.010995 0.000522 0.008796 0.000313 0.007037 0.000188 0.005629 0.000113 0.004504 6.77E-05 0.05 0 t-18 a(1-a) 18 0.003603 4.06E-05 t-19 a(1-a) 19 0.002882 2.44E-05 t-20 a(1-a) 20 0.002306 1.46E-05 FTSE 250 24 +0.70% Ő Search Exponential weights -a-0.2-a-0.4 t t-1 t-2 t-3 t-4 t-5 t-6 t-7 t-8 t-9 t-10t-11t-12t-13t-14t-15t-16t-17t-18t-19-20 Period 9 0 11:14 12/04/2024 PRE
Expert Solution
steps

Step by step

Solved in 2 steps

Blurred answer
Similar questions
  • SEE MORE QUESTIONS
Recommended textbooks for you
Managerial Economics: Applications, Strategies an…
Economics
ISBN:
9781305506381
Author:
James R. McGuigan, R. Charles Moyer, Frederick H.deB. Harris
Publisher:
Cengage Learning
Principles of Economics 2e
Economics
ISBN:
9781947172364
Author:
Steven A. Greenlaw; David Shapiro
Publisher:
OpenStax
ECON MICRO
ECON MICRO
Economics
ISBN:
9781337000536
Author:
William A. McEachern
Publisher:
Cengage Learning