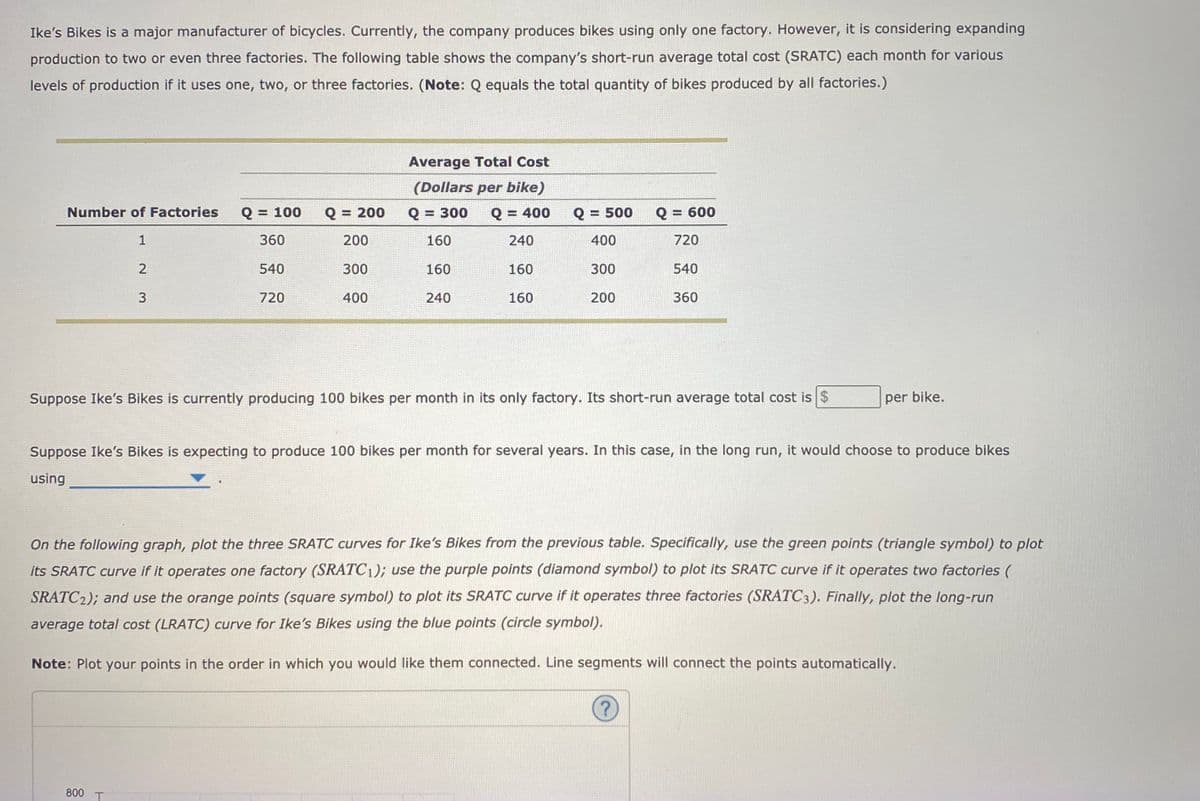
Ike's Bikes is a major manufacturer of bicycles. Currently, the company produces bikes using only one factory. However, it is considering expanding production to two or even three factories. The following table shows the company's short-run average total cost (SRATC) each month for various levels of production if it uses one, two, or three factories. (Note: Q equals the total quantity of bikes produced by all factories.) Average Total Cost (Dollars per bike) Number of Factories Q = 100 Q = 200 Q = 300 Q = 400 Q = 500 Q = 600 1 360 200 160 240 400 720 540 300 160 160 300 540 3 720 400 240 160 200 360 Suppose Ike's Bikes is currently producing 100 bikes per month in its only factory. Its short-run average total cost is $ per bike. Suppose Ike's Bikes is expecting to produce 100 bikes per month for several years. In this case, in the long run, it would choose to produce bikes using
Ike's Bikes is a major manufacturer of bicycles. Currently, the company produces bikes using only one factory. However, it is considering expanding production to two or even three factories. The following table shows the company's short-run average total cost (SRATC) each month for various levels of production if it uses one, two, or three factories. (Note: Q equals the total quantity of bikes produced by all factories.) Average Total Cost (Dollars per bike) Number of Factories Q = 100 Q = 200 Q = 300 Q = 400 Q = 500 Q = 600 1 360 200 160 240 400 720 540 300 160 160 300 540 3 720 400 240 160 200 360 Suppose Ike's Bikes is currently producing 100 bikes per month in its only factory. Its short-run average total cost is $ per bike. Suppose Ike's Bikes is expecting to produce 100 bikes per month for several years. In this case, in the long run, it would choose to produce bikes using

Chapter22: Supply: The Costs Of Doing Business
Section: Chapter Questions
Problem 11E

Related questions

Question
Transcribed Image Text:Ike's Bikes is a major manufacturer of bicycles. Currently, the company produces bikes using only one factory. However, it is considering expanding
production to two or even three factories. The following table shows the company's short-run average total cost (SRATC) each month for various
levels of production if it uses one, two, or three factories. (Note: Q equals the total quantity of bikes produced by all factories.)
Average Total Cost
(Dollars per bike)
Number of Factories
Q = 100
Q = 200
Q = 300
Q = 400
Q = 500
Q = 600
%3D
1
360
200
160
240
400
720
2
540
300
160
160
300
540
720
400
240
160
200
360
Suppose Ike's Bikes is currently producing 100 bikes per month in its only factory. Its short-run average total cost is $
per bike.
Suppose Ike's Bikes is expecting to produce 100 bikes per month for several years. In this case, in the long run, it would choose to produce bikes
using
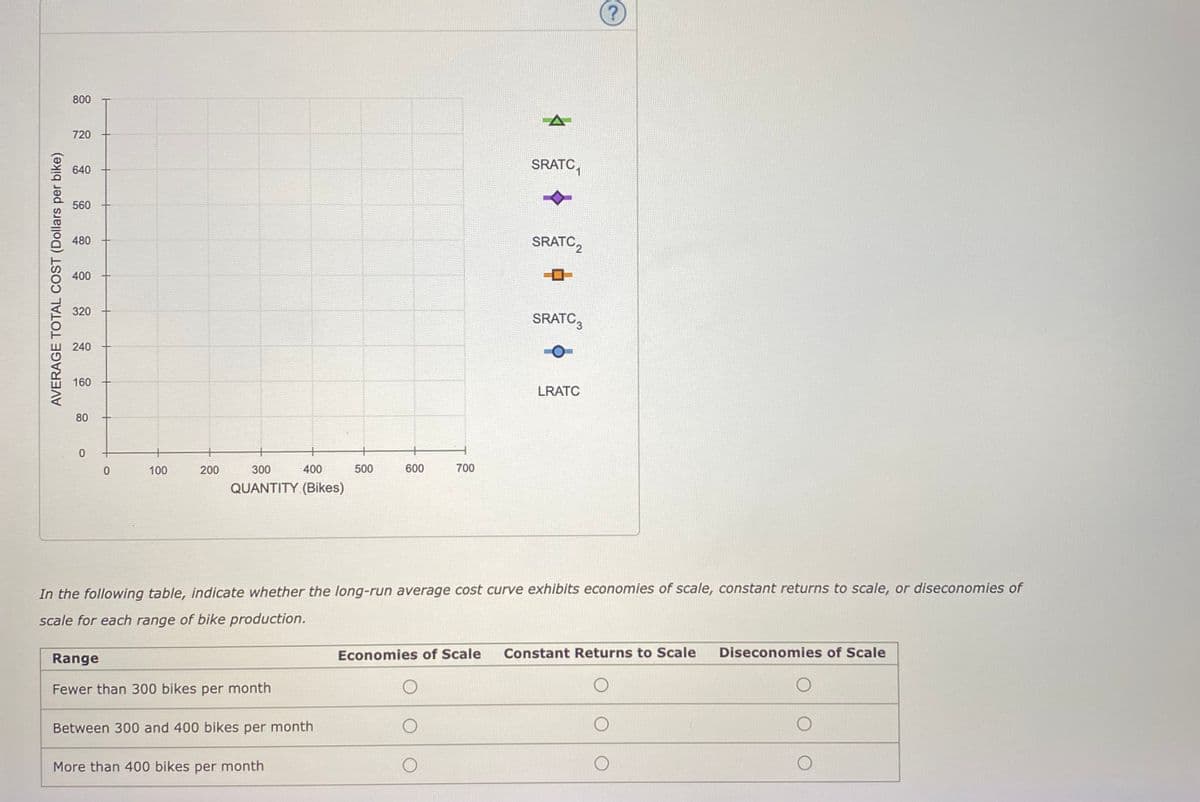
On the following graph, plot the three SRATC curves for Ike's Bikes from the previous table. Specifically, use the green points (triangle symbol) to plot
its SRATC curve if it operates one factory (SRATC1); use the purple points (diamond symbol) to plot its SRATC curve if it operates two factories (
SRATC2); and use the orange points (square symbol) to plot its SRATC curve if it operates three factories (SRATC3). Finally, plot the long-run
average total cost (LRATC) curve for Ike's Bikes using the blue points (circle symbol).
Note: Plot your points in the order in which you would like them connected. Line segments will connect the points automatically.
800
T
Transcribed Image Text:800
720
SRATC,
640
560
480
SRATC,
400
320
SRATC3
240
160
LRATC
80
100
200
300
400
500
600
700
QUANTITY (Bikes)
In the following table, indicate whether the long-run average cost curve exhibits economies of scale, constant returns to scale, or diseconomies of
scale for each range of bike production.
Range
Economies of Scale
Constant Returns to Scale
Diseconomies of Scale
Fewer than 300 bikes per month
Between 300 and 400 bikes per month
More than 400 bikes per month
AVERAGE TOTAL COST (Dollars per bike)
Expert Solution
This question has been solved!
Explore an expertly crafted, step-by-step solution for a thorough understanding of key concepts.

This is a popular solution!

Trending now
This is a popular solution!

Step by step
Solved in 4 steps with 1 images

Knowledge Booster


Learn more about
Need a deep-dive on the concept behind this application? Look no further. Learn more about this topic, economics and related others by exploring similar questions and additional content below.Recommended textbooks for you

Managerial Economics: A Problem Solving Approach
Economics
ISBN:
9781337106665
Author:
Luke M. Froeb, Brian T. McCann, Michael R. Ward, Mike Shor
Publisher:
Cengage Learning

Managerial Economics: Applications, Strategies an…
Economics
ISBN:
9781305506381
Author:
James R. McGuigan, R. Charles Moyer, Frederick H.deB. Harris
Publisher:
Cengage Learning
Managerial Economics: A Problem Solving Approach
Economics
ISBN:
9781337106665
Author:
Luke M. Froeb, Brian T. McCann, Michael R. Ward, Mike Shor
Publisher:
Cengage Learning
Managerial Economics: Applications, Strategies an…
Economics
ISBN:
9781305506381
Author:
James R. McGuigan, R. Charles Moyer, Frederick H.deB. Harris
Publisher:
Cengage Learning

Microeconomics: Principles & Policy
Economics
ISBN:
9781337794992
Author:
William J. Baumol, Alan S. Blinder, John L. Solow
Publisher:
Cengage Learning

