Illustrate the rejection region
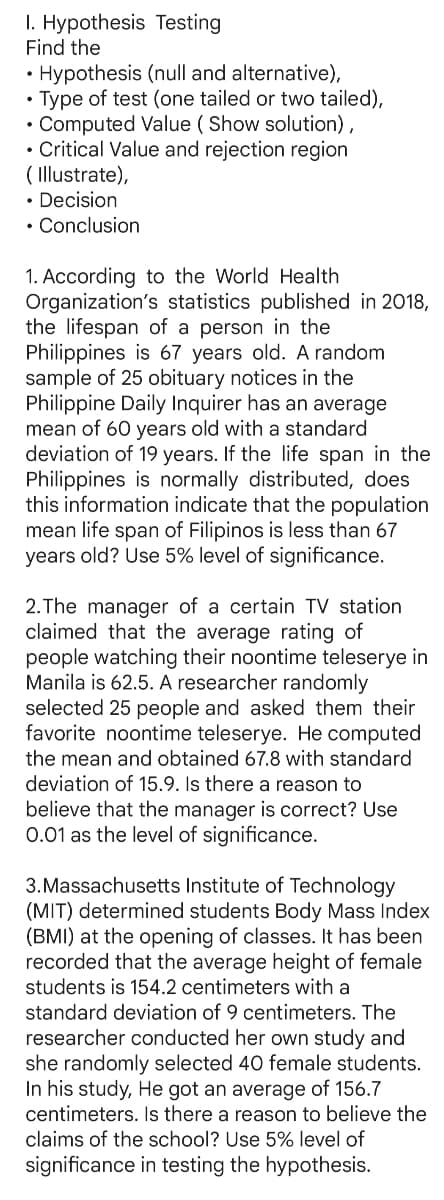
Q: 1. What is the value of the correlation between Academic Performance and Digital Literacy? A. r =…
A: The provided information is Academic Performance (x) Digital Literacy store (y) xy x2 y2 87 91…
Q: hange: 2016 2017 2018 2019 2020 2021 2,465 2,092 1,783 1,513 1,287 1,094 What is the…
A: year (x) = independent variable The Bluegill population (y) = dependent variable Year (x)…
Q: A researcher is exploring the relationship of academic performance of students in an online class to…
A: Given the data as ID Academic performance Digital literacy Score Speed of internet connection…
Q: Write your interpretations on the space provided below. RIDDLE: "What can you break, even if you…
A: Given data: N=7Observations=51.5, 54.5, 52.7, 56.5, 58.79, 48.5, 49.5
Q: Find: Let X be uniform in (0, 2). Let Y be the output of a "clipper": J X X ≤ 1 Y = g(x) = { 1 X > 1…
A: Please give a thumb.
Q: a) The traditional belief is that yawning is contagious - one yawn can lead to another yawn, w lead…
A: Since you have posted a question with multiple subparts, we will solve first three subparts for you.…
Q: Let X be a continuous random variable with CDF Fx (x). Consider derived random variable Y = g(X),…
A:
Q: on ti 84 plus
A: The table shows the budget for the years 2004 and 2006.
Q: Another responsibility of Mr. Gomez is to check the mixing of different flavors in the mystery bags.…
A: Given P=310 n=40 x=14
Q: Can I get the answer to 6
A: Scatter plot is used to display two numerical variable. It used to understand whether there is any…
Q: A statistics professor plans classes so carefully that the lengths of her classes are uniformly…
A: Given A statistics professor plans classes so carefully that the lengths of her classes are…
Q: 15. To test whether a die is fair, 80 rolls were made, and the corresponding outcomes were as…
A:
Q: PROBLEM 1. Suppose in a certain municipality, it is of interest to study the peoples' attitudes…
A: "Since you have asked multiple questions, we will solve the first question for you. If you want any…
Q: The following table shows the Myers-Briggs personality preference and area of study for a random…
A: The question is about chi squares test Given :
Q: 4) The following table gives the percentage of students registered in a specific math class for the…
A: It is needed to test the claim that the current registration percentages are the same as the ones in…
Q: Inferential statistics involve an analysis of a population in order to generalize results to smaller…
A: We have given a statement: Inferential statistics involve an analysis of a population in order to…
Q: Which one measure of central tendency should you report for the variable AGE (people write their…
A: Measures of central tendency: In statistics, some measures are used to find the middle value or…
Q: There are 15 mobile phones in a package box, 8 of which are iphones. If a person takes 5 phones from…
A: Number of mobile phones=15 Number of iphones=8 Number of phones selected from the box=5 The…
Q: (a) Why is the sample not guaranteed to be a representative sample with respect to the classes of…
A: Given Information: A trainer is interested to study the training programs used by competitors to…
Q: Solve the following deciles to decode the answer to the riddle. Complete the interpretations below…
A: D2=2(5+1)/10 th item =1.2 th item =61 D2=20% of the ages of the Philippine Presidents living as…
Q: You are helping to plan a clinical trial of a vaccine, and want to be able to detect rare serious…
A: Given that, A particular serious symptom occurs in 1 of every 40000 people in the general…
Q: Suppose 6 of 15 students in a grade school develop influenza, whereas 20% of grade school class…
A:
Q: What is the critical value of F at the 0.010.01 level? Please round your answer to four decimal…
A: Df(error)=16-4 =12 Now let us find critical value of F,given data is Df 1=4 Df 2=12…
Q: Let X be a random variable with the following probability distribution: X -4 3 5 f(x) 0.3 0.2 0.5…
A: Given,E(X)=∑X.f(X)
Q: 3. A correlation coefficient of 0.7 is discovered in a sample of 28 pairs. Apply z transformation to…
A:
Q: At Pacific Freight Lines, bonuses are given to billing clerks when they complete 300 or more freight…
A:
Q: In a study about the life expectancy of 200 thirty-year old males, the mean is 65 and the standard…
A: Sample size(n)=200 Mean(μ)=65 Standard deviation(σ)=10 The proportion of the males who live past 75…
Q: Mr. Gomez is a quality control officer in a candy company. One of his responsibilities is ensuring…
A: The provided information is n=40x¯=338σ=10α=0.05The critical value for α=0.05zc=1.96 (from z…
Q: Generally speaking, larger sample sizes (n) reduce the chances of making a Type I error. Group of…
A: We have given statement is " Larger sample sizes (n) reduce the chances of making a Type I error"
Q: A brewery filling machine is adjusted to fill quart bottles with a mean of 32.0 oz of ale and a…
A: The provided information is µ=32.0 σ2=0.003σ=σ2=0.003=0.055 a.…
Q: State the appropriate test of hypothesis to investigate your suspicion that fewer than 80% of the…
A: here given , A company reports that 80% of its employees participate in the company's stock purchase…
Q: Five of your classmates measured the diagonal length of the blackboard. Classmate A measured it as…
A: Average and standard deviation are measures of central tendency and variance respectively.
Q: significant
A:
Q: As soon as possible! Let X and Y as below, a) Marginal PMFs PX(x) and PY (y). b) Expected…
A: Given
Q: Given the following observations from a sample, calculate the mean, the median, and the mode. (Round…
A:
Q: <ct Score Frequency 4 46-50 8 41-45 11 36-40 31-35 9 26-30 12 21-25 6 16. The upper quartile score…
A: Since you have asked multiple questions, we will solve the first question for you. If you want any…
Q: 2. population Show that in samples of 25 from an uncorrelated normal the chance is 1 in 100 that r…
A:
Q: 2. A group of students working on their thesis took a random sample of 100 families in a certain…
A: Given Sample size=100, sample mean x̄=1146, sample standard deviations s=650 Construct 90% CI for…
Q: pectively (²1,0 but unknown variance. d the likelihood ratio A for testing Ho: 1 = 2 = 0 aga -S.
A: *Answer:
Q: The following table shows the Myers-Briggs personality preferences for a random sample of 406 people…
A: The following information has been given: Observed Frequencies E I Total clergy 59 48 107…
Q: Find the area of the shaded region. The graph to the right depicts IQ scores of adults, and those…
A: Required probability is P(102<X<132)
Q: The correlation between the price indices of animal feeding-stuffs and home-grown cats in a sample…
A:
Q: Suppose scores from a certain test were distributed roughly normally, with a mean score of 75 with a…
A: Since you have posted a question with multiple sub-parts, we will solve first three subparts for…
Q: Of interest is to determine if the employer of the meteorologist is associated with how well they…
A: Given that Of interest is to determine if the employer of the meteorologist is associated with how…
Q: Find the following probability for the standard normal random variable z. a. P(−1.96≤z<−0.22)…
A: Given a. P(−1.96≤z<−0.22) b. P(z≥0) c. P(−2.35≤z≤1.45)…
Q: Answer the following: 1. While fishing in a pond lake, Brock determined that the probability that…
A: Hi! Thank you for the question as per the honor code, we’ll answer the first question since the…
Q: Intelligent test were given to two groups of boys and girls with mean , Standard deviation and Size…
A: Given Boys Sample size n1=60, sample mean x̄1=75, sample standard deviations s1=8 Sample size…
Q: How large a sample would have to be drawn to make these limits differ by only 0·1 gm, assuming that…
A: The objective is to find the sample size required so that the limits differ by only 0·1 gm,…
Q: With the same given above, can you please answer the remaining two questions below? Find a 95%…
A: The confidence interval is calculated by the combined value of sample statistic and the margin of…
Q: A one-sample z-test was used to test the following hypotheses: Ho: μ = 47 and H₁ : µ ‡ 47. Select…
A:
Step by step
Solved in 2 steps with 3 images
- A manufacturer is developing a nickel-metal hydride battery to be used in cellular telephones instead of a nickel-cadmium battery. The director of quality control decides to evaluate the newly developed battery by picking a random sample of employees with cellular phones and asking them to use both phones until the batteries run down. The results are given in the excel data file. At the 5% level of significance is there evidence that the new battery provides more minutes of talk time per battery charge? Show your work and give your answer in complete sentences in context of the problem. Data Table: Person Old Battery Type New Battery Type 1 72.39 89.95 2 75.25 64.60 3 82.10 71.25 4 58.98 87.07 5 67.07 103.11 6 35.98 76.46 7 75.37 83.92 8 66.00 83.42 9 73.14 84.30 10 67.14 92.48 11 83.06 93.48 12 57.00 59.11 13 65.92 92.27 14 76.12 61.81 15 85.21 72.83 16 80.73 42.17 17 60.65 83.89 18 36.63 94.41 19 77.98 70.30 20 75.40 77.72 21 84.70 84.35…A company takes a closer look at what CEOs are looking for and are finding as new sources of value in their businesses and industries. The results of a recent survey, summarized in the accompanying table, classified CEOs by the main opportunity that they identified for business growth in their companies as well as their geographic region. At the 0.05 level of significance, is there evidence of a significant relationship between the identified main opportunity and geographicregion? Identify the null and alternative hypotheses.Is College Worth It? In the New York Times article “College Graduates Fare Well in Jobs Market, Even through Recession,” C. Rampell noted that college graduates have suffered through the recession and lackluster recovery with remarkable resilience. Of a random sample of 1020 college graduates, 35 were unemployed; and of a random sample of 1008 high-school graduates (no college), 69 were unemployed. a. At the 1% significance level, do the data provide sufficient evidence to conclude that college graduates have a lower unemployment rate than high-school graduates? b. Find and interpret a 98% confidence interval for the difference in unemployment rates of college and high-school graduates.
- Statistics Based on information about computer damage due to: 20% carelessness of the operator, 40% fluctuations in electricity voltage, 15% virus and 25% due to high room temperature. To test the validity of the information, samples were taken from 150 damaged computers and it turned out that there were 30 damaged units due to operator carelessness, 55 units due to voltage fluctuations, 20 due to viruses and the rest were damaged due to the high temperature of the room. By using the significance level = 0.05, can the results of the observations justify the information above?Suppose that you want to conduct a left-tailed hypothesis test at the 5% significance level. How must the critical value be chosen?The Knight Foundation investigates whether high school students agreed with the statement that people should be allowed to burn or deface the American flag as a political statement. This question was asked in a survey of a representative sample of high school students in 2004 and also in a survey of a representative sample of high school students in 2014. Suppose that the sample size was 1000 in each of the two years. Data consistent with summary values given in the paper are summarized in the accompanying table. Is there convincing evidence that the proportions falling into each of the response categories were not the same for high school students in 2004 and 2014?
- The Knight Foundation investigates whether high school students agreed with the statement that people should be allowed to burn or deface the American flag as a political statement. This question was asked in a survey of a representative sample of high school students in 2004 and also in a survey of a representative sample of high school students in 2014. Suppose that the sample size was 1000 in each of the two years. Data consistent with summary values given in the paper are summarized in the accompanying table. Is there convincing evidence that the proportions falling into each of the response categories were not the same for high school students in 2004 and 2014? What type of question is this-estimation or hypothesis?What type of study is this sample data or experiment data?What type of data is this? Univariate or bivariate? Categorical or Numerical?How many samples or treatments?Generate a research scenario of 40 participants where a one-way ANOVA needs to be employed. Your data must produce a significant overall result, and there should be a post-hoc test performed and interpreted.An expert at the Icelandic Meteorological Office is tasked with investigating whether the air quality in the capital area is in accordance with health protection limits. According to them, dust particles should not amount to more than 50 micrograms per cubic meter. The expert collects readings from around the town between 9 and 10 in the morning a. State and perform a one-sided hypothesis test (at a 2% level of significance) about whether the population mean is greater than 50 micrograms. NOTE that the Norwegian Meteorological Agency assumes that the air quality is acceptable unless there is strong evidence that this is not the case. b. Show the result of the test in a picture. What does the result tell you about the sampling distribution of the sample mean? c. What is the p-value and what does it tell you? Show it in the picture you made in part b d. Draw the power function of the hypothesis test e. The measuring devices that are used to measure air quality can be problematic, so…
- The Digital Guardian Company issues policies that protectclients from downtime costs due to computer system failures.It is very important to process the policies quickly becauselong cycle times not only put the client at risk, they couldalso lose business for Digital Guardian. Management is con-cerned that customer service is degrading because of longcycle times, measured in days. The following table containsthe data from five samples, each sample consisting of eightrandom observations a. What is your estimate of the process average?b. What is your estimate of the average range?c. Construct an R- and an x-chart for this process.Are assignable causes present?A check-cashing service has found that approximately 5% of all checks submitted to the service for cashing are bad. After instituting a check verification system to reduce its losses, the service found that only 45 checks were bad in a total of 1124 cashed. b). Which statistical distribution should be applied in this situation and why? Explain carefully. c). Knowing that a significant amount of capital investment were required to institute the system, should the service put much weight on the conclusion of part (a)? Explain carefully.Consider the mean grade point average, suppose we take a random sample of n 25 students majoring in english. Also, suppose we set our significance level at 0.05, then the critical value for conducting two tailed hypothesistesing test for population mean gpa wil be.