Illustration 33. The heights of mothers and daughters are given in the following table. From the two lifes of regression estimate the expected average height of the daughter when the height of the mother is 64.5 inches. Ht. of Mother in inches 62 63 64 64 65 66 68 70 Ht. of daughter in inches 64 65 61 69 67 68 71 65
Illustration 33. The heights of mothers and daughters are given in the following table. From the two lifes of regression estimate the expected average height of the daughter when the height of the mother is 64.5 inches. Ht. of Mother in inches 62 63 64 64 65 66 68 70 Ht. of daughter in inches 64 65 61 69 67 68 71 65

Chapter3: Functions
Section3.3: Rates Of Change And Behavior Of Graphs
Problem 27SE: Table 4 gives the population of a town (in thousand) from 2000 to 2008. What was the average rate of...

Related questions
Question
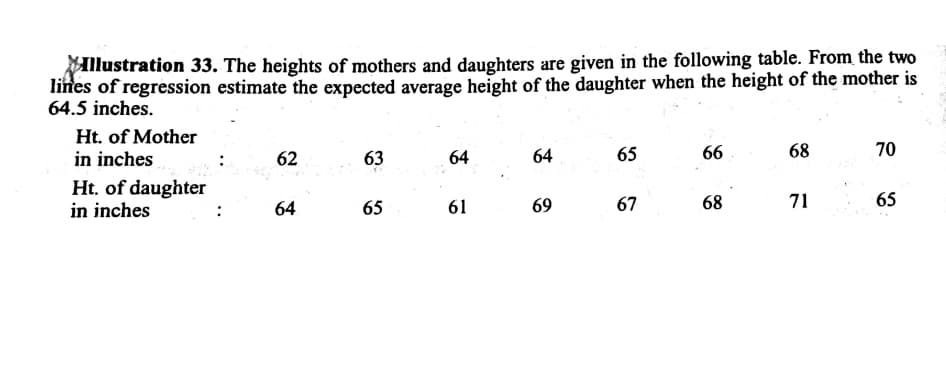
Transcribed Image Text:Illustration 33. The heights of mothers and daughters are given in the following table. From the two
lines of regression estimate the expected average height of the daughter when the height of the mother is
64.5 inches.
Ht. of Mother
in inches
62
63
64
64
65
66
68
70
Ht. of daughter
in inches
64
65
61
69
67
68
71
65
Expert Solution
This question has been solved!
Explore an expertly crafted, step-by-step solution for a thorough understanding of key concepts.

This is a popular solution!

Trending now
This is a popular solution!

Step by step
Solved in 2 steps

Recommended textbooks for you

Big Ideas Math A Bridge To Success Algebra 1: Stu…
Algebra
ISBN:
9781680331141
Author:
HOUGHTON MIFFLIN HARCOURT
Publisher:
Houghton Mifflin Harcourt

Algebra & Trigonometry with Analytic Geometry
Algebra
ISBN:
9781133382119
Author:
Swokowski
Publisher:
Cengage
Big Ideas Math A Bridge To Success Algebra 1: Stu…
Algebra
ISBN:
9781680331141
Author:
HOUGHTON MIFFLIN HARCOURT
Publisher:
Houghton Mifflin Harcourt
Algebra & Trigonometry with Analytic Geometry
Algebra
ISBN:
9781133382119
Author:
Swokowski
Publisher:
Cengage

Functions and Change: A Modeling Approach to Coll…
Algebra
ISBN:
9781337111348
Author:
Bruce Crauder, Benny Evans, Alan Noell
Publisher:
Cengage Learning