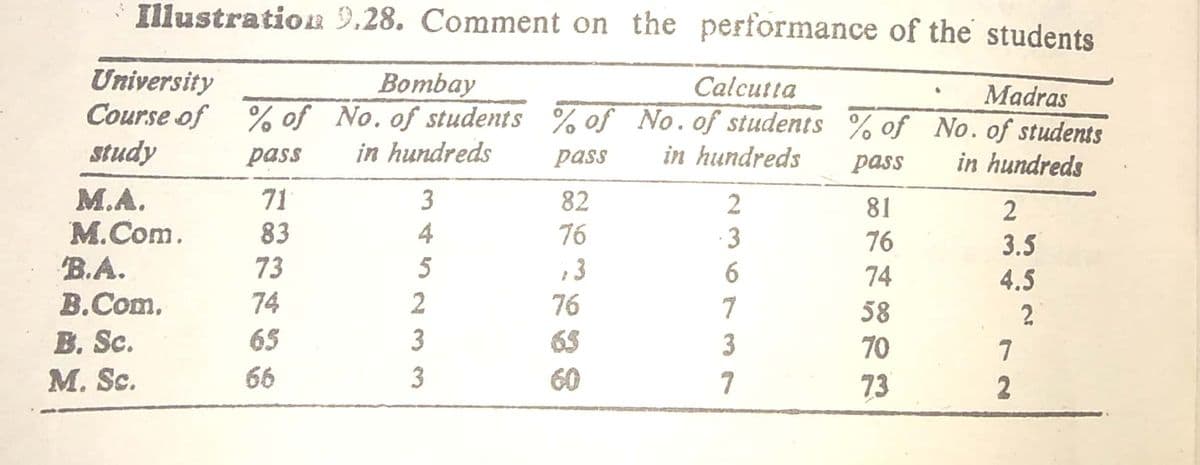
Illustration 9.28. Comment on the performance of the students University Course of % of No.of students % of No.of students % of No.of students study Bombay Calcutta Madras pass in hundreds pass in hundreds pass in hundreds М.A. М.Com. 71 3 82 2 81 83 4 76 76 3.5 B.A. B.Com. 73 5 13 76 74 4.5 74 2 58 2 B. Sc. 65 3 65 70 7 M. Sc. 66 3 60 73 2 2 36 37


Q: Suppose that, of all the customers at a coffee shop, 70% purchase a cup of coffee; 40% purchase a…
A: The provided information is P(Coffee)=0.70 P(Cake)=0.40 P(Coffee and Cake)=0.20
Q: Listed below are the amounts of net worth (in millions of dollars) of the ten wealthiest celebrities…
A: Given data: 265,210,189,172,168,167,147,147,147,142
Q: Complete the curve below by entering the values of areas under the curve, the values of 1, 2 and 3…
A: The provided information is µ=80 σ=20 n=500 a. The empirical rule is µ=80 1 68% µ-σ and µ+σ…
Q: 1. Let A and B be two events such that P(A) = 0.4, P(B) = 0.7, P(A U B) = 0.9 a) Find P(A N B). b)…
A: The probability of an event gives the chances of occurrence of the event. The value of the…
Q: The National Assessment for Educational Progress (NAEP) is a U.S. government organization that…
A: Scatter plot is the graphical representation of the relationship between two variables of a…
Q: (b) A manager of a recreational club would like to compare the satisfaction level between their male…
A: There are two independent samples which are male and female. We have to test whether the male…
Q: Solve the following problems and answer the following questions, based upon the following context,…
A: Given information: Bronze Silver Gold Platinum Total 60 40 80 120 300…
Q: he St. Lucian Government is interested in predicting the number of weekly riders on the public buses…
A: Given The St. Lucian Government is interested in predicting the number of weekly riders on the…
Q: The fraction of defective integrated circuits produced in a photolithography process is being…
A:
Q: Illustration 22. Given below are the data relating to the vearly sales of a retail shop : 1998 140…
A:
Q: 10 points Q/ In the vehicle speed test, the results are given in the table below: Find 1. Arithmetic…
A:
Q: Experiments on learning in animals sometimes measure how long it takes mice to find their way…
A:
Q: Illustration 22.5. Fill in the blanks which are marked with a •It*may, however, be stated here that…
A:
Q: Independent samples t-test- In the pop-up window, select the 24 scale variables (Study thru Attend2)…
A: The given question contains data for 28 variables under study. Independent t-tests have to be…
Q: Fit a parabolic equation of second degree to the following data and obtain the trend values…
A:
Q: From the below table, Use excels to find the answer for the below questions: State Percentage…
A: Solution: Let X be the percentage proficient in reading and Y be the percentage proficient in…
Q: Fit the exponential trend for the following data and find the trend values Year : 1958 1968 1978…
A:
Q: Suppose you wish to determine whether there are differences in the average prices among 3 major…
A:
Q: A product engineer wants to optimize the cutting of strips of wood, which are used to ma plywood. To…
A: 1) The objective is to test whether there is a significant difference in mean of torque force for…
Q: C. Compute the sample coefficient of determination and interpret. D. Using a 0.01 level of…
A: The provided information is Temperature x Conv. Sugar y xy x2 y2 1.0 8.1 8.1 1 65.61 1.1 7.8…
Q: ) Find the probability of randomly selecting an ELT and getting one manufactured by the Bryant…
A: Let us define some events A : an ELT is manufactured by Altigauge company. B : an ELT is…
Q: Find the probability distribution for the number of Modern CD when 4 CDs are selected at random from…
A: Probability distribution: A probability distribution is a statistical function that describes all…
Q: 11. Refer to the accompanying data set of 20 randomly selected presidents. Treat the data as a…
A: The following information has been given: The number of presidents who are taller than their…
Q: pulation, i.e. {Xifi=1• In al to pi. Please demonst
A: It is known that, n=z1-α2+z1-βES
Q: Corey is asked to look carefully through the five scenarios above and to identify for which…
A: Given: Hypothesis testing of different scenarios with test statistic are given: Ho: p = 0.3 vs.…
Q: .If a random variable X has the gamma distribution with α = 2 and β = 1, find P(1.8 < X < 2.4).
A: Since you have posted multiple questions, as per our guidelines, we have provided answer for first…
Q: 3. A population consists of the data (a, b, c). List all the possible samples of size 2 which can be…
A:
Q: A U.S. Travel Data Center survey conducted for Better Homes and Gardens of 1500 adults found that…
A: Given: sample size, n=1500 sample proportion, p = 0.39
Q: food safety guideline is that the mercury in fish should be below 1 part per million (ppm). Listed…
A: Given that 0.57 0.78 0.09 0.98 1.34 0.57 0.85 Sample size n =7 Arrange the data set in the…
Q: E-cigare Lettery-operated devices that can deliver nicotine and other chemicals in water instead of…
A: (a) From the given data, at 6 months verified abstinence was 7.3% (21 of 289) with nicotine…
Q: A product engineer wants to optimize the cutting of strips of wood, which are used to make plywood.…
A: 1) The objective is to test whether there is a significant difference in mean of torque force for…
Q: Using three yearly moving averages, determine the trend and short term. fluctuations. Year : 1989…
A:
Q: Before conducting inference for regression slope we need to check several assumptions be looking tat…
A:
Q: Q/ In the vehicle speed test, the results are given in the table below: Find 1. Arithmetic mean 2.…
A:
Q: Use the accompanying data set to complete the following actions. a. Find the quartiles. b. Find the…
A:
Q: The 2022 MotoGP race will take place in Indonesia on March 18-20. The racers will compete at the…
A: Since you have posted a question with multiple sub-parts, we will solve first three subparts for…
Q: Suppose X has a Poisson distribution with parameter A and suppose the conditional distribution of Y…
A: It is given that X ~ Poisson with parameter λ And Y | X = x ~ Exp(θ = x+1)
Q: careful attention to requested levels of precision when reporting answers. The management at…
A:
Q: the
A: Pearson's Correlation: This is a statistic used to measure the linear relationship between two…
Q: It is claimed that 20% of dog owners have at least two dogs. A researcher believes that more than…
A: We have to identify what is the mistake made in following hypothesis, Ho: p = 0.32 V/S Ha: p…
Q: The Canadian Federation of Independent Business (CFIB) sent an online survey to 3000 small…
A:
Q: 2. A psychologist estimates the I.Q of 28 students. The values are as follows: 103, 86, 94, 97, 100,…
A:
Q: Suppose the age that children learn to walk is normally distributed with mean 11 months and standard…
A: Let X be the random variable from Normal distribution with mean (µ) = 11, standard deviation (σ) =…
Q: A study was made on the amount of converted sugar in a certain process at various temperatures. The…
A:
Q: 1. The grades of a class of 9 students on a midterm report and on the final examination are as…
A: By correlation we mean the association or interdependence between two variables. If two variables…
Q: From the following data find the cyclical variations under both the models che residual method :…
A:
Q: A set of 11 data pairs (x,y) were collected and were found to have a linear relationship given by: y…
A:
Q: f. What is our critical F value (from table)? g. Fill in the ANOVA summary table with your data Sum…
A:
Q: A grade 7 class adviser wants to find the age of his/her advisory. It happens that it is during the…
A:
Q: Instructions Solve the given problem. A researcher is interested in estimating the average monthly…
A: Given that Margin of error =E =8500 Population standard deviation =1150 90% confidence interval.


Step by step
Solved in 4 steps with 4 images

- A dietitian wishes to see if a person’s cholesterol level will be changed if the diet is supplemented by a certain mineral. Four subjects were pre-tested, and they took the mineral supplement for a 6-week period. The results are shown in the table. Is there sufficient evidence to conclude that the population mean of cholesterol levels has been changed after six weeks at α=0.2α=0.2? Assume that the differences are from an approximately normally distributed population. Subject Cholestrol Level (mg/dl) Cholestrol Level after 6 Weeks (mg/dl) dd ¯dd¯ (d−¯d)2(d-d¯)2 1 206 217 11 2 219 184 -35 3 202 204 2 4 213 205 -8 Total -30 a) Calculate the mean, the sum of the squared deviation from the mean, and the standard deviation of differences. Do not include the unit for each answer: ¯d=d¯= (do not round) ∑(d−¯d)2=∑(d-d¯)2= (do not round) sd=sd= (rounded to one decimal place) b) Perform the hypothesis test in the following steps: Step 1.…An urban community wants to show that the incidence of breast cancer is higher in their locality than in a neighboring rural area. (PCB levels were found to be higher in the soil of the urban community). If you find that in the urban community 20 out of 200 adult women have breast cancer and that in the rural community 10 out of 150 adult women have it, could you conclude, at a significance level of 0.05, that breast cancer is more prevalent in the urban community?1. The parameter of interest is:2. The hypotheses for this test are:3. The calculated test statistic is:4. The critical region is:5. Draw the critical region (make decision):6. It can be concluded that:A pharmcuticle company claims that its new drug reduces systolic blood pressure. The systolic blood pressure (in millimeters of Mercury) for 9 patients before taking the new drug and 2 hours after taking the drug are shown in the table below. is there enough evidence support the company's claim? Let D =(blood pressure before taking new drug)- (blood pressure after taking new drug).use significant levels of a=their 0.05 for the test. Assume that the systolic blood pressure levels are normally distributed for the population of patience both Before & After taking the new drug. 1.State the null and alternative hypothesis for the test. 2. Find the value of the standard deviation of the paired differences. Round to one decimal place. 3.compute the value of the test statistic. Round to three decimal places 4.determine the decision rule for rejecting the null hypothesis Ho. Round the numerical portion to three decimals. 5.make decision for the hypothesis test.
- Compute the sum-of-squares error (SSE) by hand for the given set of data and linear model. (8, 10), (9, 11), (16, 20), (12, 2); y = 2x − 8The article “Withdrawal Strength of Threaded Nails” (D. Rammer, S. Winistorfer, and D. Bender, Journal of Structural Engineering 2001:442–449) describes an experiment comparing the ultimate withdrawal strengths (in N/mm) for several types of nails. For an annularly threaded nail with shank diameter 3.76 mm driven into spruce-pine-fir lumber, the ultimate withdrawal strength was modeled as lognormal with μ = 3.82 and σ = 0.219. For a helically threaded nail under the same conditions, the strength was modeled as lognormal with μ = 3.47 and σ = 0.272. a) What is the mean withdrawal strength for annularly threaded nails? b) What is the mean withdrawal strength for helically threaded nails? c) For which type of nail is it more probable that the withdrawal strength will be greater than 50 N/mm? d) What is the probability that a helically threaded nail will have a greater withdrawal strength than the median for annularly threaded nails? e) An experiment is performed in which withdrawal…Test the hypothesis that the average weekly allowance of female and male ACC 215 students the same, at 5%l evel of significance. Weekly Allowance of Students (Php) Male: 1500 2000 2500 2500 2000 1750 2000 1800 Female:1500 2000 1750 1500 2000 2500 3000 3500 Ho: Ha: α = Decision Rule: Computation: Decision: Conclusion:
- The article “Effect of Varying Solids Concentration and Organic Loading on the Performance of Temperature Phased Anaerobic Digestion Process” (S. Vandenburgh and T. Ellis, Water Environment Research, 2002:142–148) discusses experiments to determine the effect of the solids concentration on the performance of treatment methods for wastewater sludge. In the first experiment, the concentration of solids (in g/L) was 43.94 ± 1.18. In the second experiment, which was independent of the first, the concentration was 48.66 ± 1.76. Estimate the difference in the concentration between the two experiments, and find the uncertainty in the estimate.A local group of economists wants to study the effects of the pandemic on the small businesses in their city. A survey was sent out to a random sample of small businesses to anonymously report both their weekly earnings in $1000 for January 2020 (group 1) and January 2021 (group 2). Assume that the weekly earnings are normally distributed. Only 10 businesses provided enough data to compute their average weekly earnings for two months. The groups are dependent. Use α = 0.01 to decide whether there is sufficient evidence that the pandemic reduced the average weekly earnings for small businesses. January 2020 January 2021 58.2 60.5 78.3 62.5 38.2 40.9 32.7 36.2 43.8 36.2 33.7 30.9 50.5 41.4 56.3 38.3 41.1 37.9 26.4 21.7 1. What are the correct hypotheses? H0: H1: 2. Based on the hypotheses, compute the following: Round answers to at least 4 decimal places. The test statistic is = The critical value is =…A local group of economists wants to study the effects of the pandemic on the small businesses in their city. A survey was sent out to a random sample of small businesses to anonymously report both their weekly earnings in $1000 for January 2020 (group 1) and January 2021 (group 2). Assume that the weekly earnings are normally distributed. Only 10 businesses provided enough data to compute their average weekly earnings for two months. The groups are dependent. Use α = 0.01 to decide whether there is sufficient evidence that the pandemic reduced the average weekly earnings for small businesses. January 2020 January 2021 58.5 29.7 37.1 50.8 48.4 36.8 44.8 33.9 72.9 36.5 27.9 45.6 78.5 58.4 53.4 51.2 83.4 47 48.2 33.6 1) What are the correct hypotheses? H0: H1: 2) Based on the hypotheses, compute the following: Round answers to at least 4 decimal places. The test statistic is = The critical value is =…
