From the following data find the cyclical variations under both the models che residual method : Month : Jan. Feb. Mar. Apr. May June July Aug. Sept. Oct. Nov. Dec Sales (in 000 Rs.) 56 28 45 39 26 34 36 38 31 32 50 60 Trend values 40 39 40 40 39 39 39 39 39 39 40 40 Seasonal variations 10 -9 8 -11 -8 -4 -5- 10 -4 7 24 Seasonal Ind. 125 76 122 108 71 78 87 85 74 91 119 164 3.
From the following data find the cyclical variations under both the models che residual method : Month : Jan. Feb. Mar. Apr. May June July Aug. Sept. Oct. Nov. Dec Sales (in 000 Rs.) 56 28 45 39 26 34 36 38 31 32 50 60 Trend values 40 39 40 40 39 39 39 39 39 39 40 40 Seasonal variations 10 -9 8 -11 -8 -4 -5- 10 -4 7 24 Seasonal Ind. 125 76 122 108 71 78 87 85 74 91 119 164 3.

Chapter3: Functions
Section3.3: Rates Of Change And Behavior Of Graphs
Problem 27SE: Table 4 gives the population of a town (in thousand) from 2000 to 2008. What was the average rate of...

Related questions
Question
100%
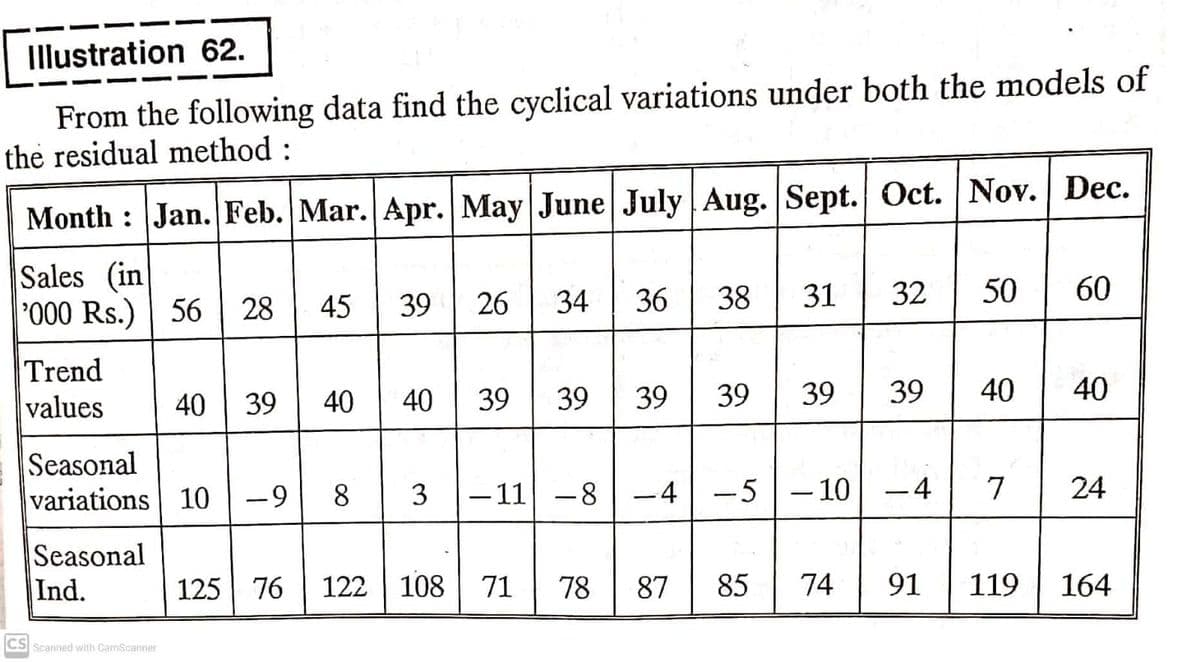
Transcribed Image Text:Illustration 62.
From the following data find the cyclical variations under both the models of
the residual method :
Month : Jan. Feb. Mar. Apr. May June July Aug. Sept. Oct. Nov. | Dec.
Sales (in
000 Rs.) 56
28
45
39
26
34
36
38
31
32
50
60
Trend
values
39
40
40
40 | 40 39
39
39
39
39
40
Seasonal
variations 10
-9 8 | 3
- 11 -8
-4 -5
- 10
4
7
24
Seasonal
Ind.
125 76
122 | 108
71
78
87
85
74
91
119
164
CS Scanned with CamScanner
39
Expert Solution
This question has been solved!
Explore an expertly crafted, step-by-step solution for a thorough understanding of key concepts.

Step by step
Solved in 3 steps with 3 images

Recommended textbooks for you

Algebra & Trigonometry with Analytic Geometry
Algebra
ISBN:
9781133382119
Author:
Swokowski
Publisher:
Cengage

Mathematics For Machine Technology
Advanced Math
ISBN:
9781337798310
Author:
Peterson, John.
Publisher:
Cengage Learning,
Algebra & Trigonometry with Analytic Geometry
Algebra
ISBN:
9781133382119
Author:
Swokowski
Publisher:
Cengage
Mathematics For Machine Technology
Advanced Math
ISBN:
9781337798310
Author:
Peterson, John.
Publisher:
Cengage Learning,