
Chapter19: Child Health
Section: Chapter Questions
Problem D1CRE

Related questions
Question
I'm honestly confused on what I'm doing!
Transcribed Image Text:A
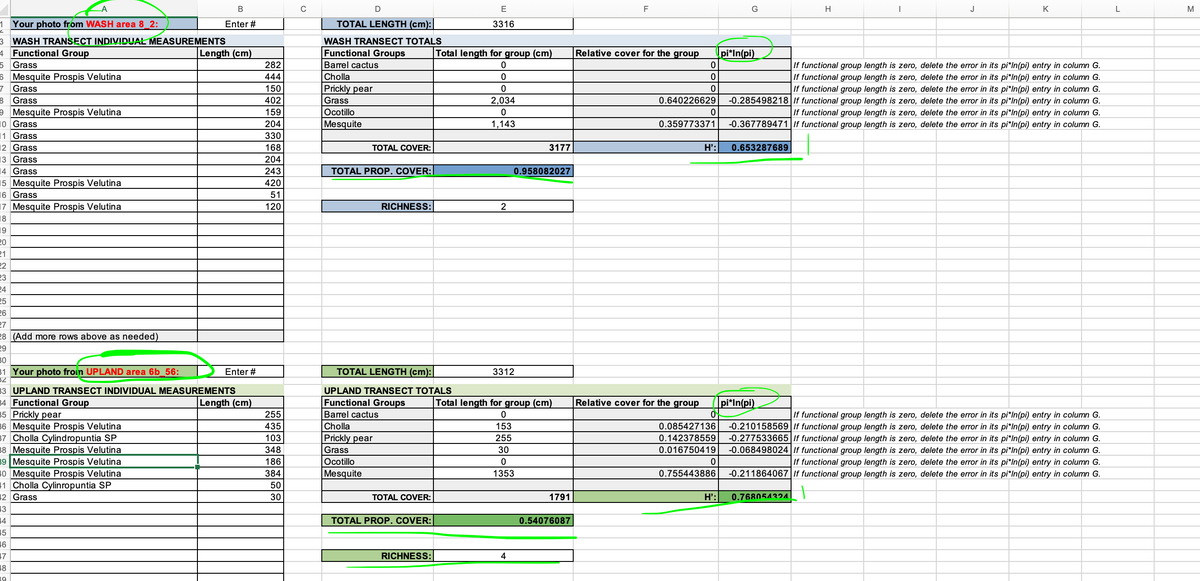
1 Your photo from WASH area 8_2:
3 WASH TRANSECT INDIVIDUAL MEASUREMENTS
4 Functional Group
5 Grass
6 Mesquite Prospis Velutina
7 Grass
8 Grass
9 Mesquite Prospis Velutina
10 Grass
1 Grass
12 Grass
13 Grass
14 Grass
15 Mesquite Prospis Velutina
16 Grass
17 Mesquite Prospis Velutina
18
19
20
21
22
23
24
25
26
27
28 (Add more rows above as needed)
29
30
1 Your photo froim UPLAND area 6b_56:
52
B
Enter #
36 Mesquite Prospis Velutina
37 Cholla Cylindropuntia SP
38 Mesquite Prospis Velutina
39 Mesquite Prospis Velutina
10 Mesquite Prospis Velutina
1 Cholla Cylinropuntia SP
12 Grass
13
14
15
16
-7
18
19
Length (cm)
33 UPLAND TRANSECT INDIVIDUAL MEASUREMENTS
34 Functional Group
Length (cm)
35 Prickly pear
Enter #
282
444
150
402
159
204
330
168
204
243
420
51
120
255
435
103
348
186
384
50
30
с
D
TOTAL LENGTH (cm):
WASH TRANSECT TOTALS
Functional Groups
Barrel cactus
Cholla
Prickly pear
Grass
Ocotillo
Mesquite
TOTAL COVER:
TOTAL PROP. COVER:
RICHNESS:
Barrel cactus
Cholla
Prickly pear
Grass
Ocotillo
Mesquite
TOTAL LENGTH (cm):|
UPLAND TRANSECT TOTALS
Functional Groups
TOTAL COVER:
TOTAL PROP. COVER:
RICHNESS:
E
3316
Total length for group (cm)
0
0
0
2,034
0
1,143
2
3312
3177
0.958082027
4
Total length for group (cm)
0
153
255
30
0
1353
1791
0.54076087
F
Relative cover for the group
0
0
0
0.640226629
Relative cover for the group
0
0.359773371
0
-0.285498218
If functional group length is zero, delete the error in its pi*In(pi) entry in column G.
If functional group length is zero, delete the error in its pi*In(pi) entry in column G.
If functional group length is zero, delete the error in its pi*In(pi) entry in column G.
If functional group length is zero, delete the error in its pi*In(pi) entry in column G.
If functional group length is zero, delete the error in its pi*In(pi) entry in column G.
-0.367789471 If functional group length is zero, delete the error in its pi*In(pi) entry in column G.
H':| 0.653287689
G
0
pi*In(pi)
H':
pi*In(pi)
H
I
0.768054324
J
If functional group length is zero, delete the error in its pi*In(pi) entry in column G.
0.085427136 -0.210158569 If functional group length is zero, delete the error in its pi*In(pi) entry in column G.
0.142378559 -0.277533665 If functional group length is zero, delete the error in its pi*In(pi) entry in column G.
0.016750419 -0.068498024 If functional group length is zero, delete the error in its pi*In(pi) entry in column G.
If functional group length is zero, delete the error in its pi*In(pi) entry in column G.
0.755443886 -0.211864067 If functional group length is zero, delete the error in its pi*In(pi) entry in column G.
K
L
M
![PART V. Calculations
For each functional group that you measured along the transect, we can get a measure of its abundance
by calculating the fraction of the transect that the functional group intersected. We will walk you
through how to do this below.
With the same data, you can also calculate some measures of biodiversity at each site. Diversity can be
described and compared in multiple ways. One method is to simply total up the number of species (or
functional groups) that you recorded in an area, and we call this measure of diversity species richness.
Richness doesn't tell us anything about the representation of the different species, however, and that
information may be of interest. For example, a habitat may be dominated by one species, with all other
species being rare; this is a pattern we call 'uneven'. In contrast, another site may have the same
species richness (number of species), but they are all present in equal quantities, which we call 'even'.
Therefore, we would like to have a measure of diversity that includes both richness and evenness.
There are several calculations for this, but one of the most common is the Shannon-Wiener Diversity
Index (H'), which is calculated like this:
H' = -Σ [p;*ln(p;)]
Unit 14 Lab Part 1 - Transect Measure
4 of 5
Where Pi
is the proportion of each species i in our dataset, and Σ means 'sum' in mathematical notation.
So H' is the sum of the proportion of each species, each weighted (multiplied) by the natural log (ln) of
that value. Take some time to understand this equation. It might look strange to you at first, but it
will make sense with some effort.
Why multiply by the natural log? Imagine if one species is dominant and its proportion is nearly '1';
because In(1) is zero, then this measure of diversity will be nearly zero. If there are several evenly
abundant species, their proportions each are smaller, but the value of the -In of each value goes up
(though more and more slowly as the numbers get smaller). Therefore, as the richness and evenness go
up, so does the value of H', making it a useful way to compare diversity among sites.](/v2/_next/image?url=https%3A%2F%2Fcontent.bartleby.com%2Fqna-images%2Fquestion%2Fb0d45dce-c646-4e67-b264-22576bb4d853%2F0e1397a5-9cc2-4549-9bfc-1114e43dd1d5%2F6w26mtt_processed.png&w=3840&q=75)
Transcribed Image Text:PART V. Calculations
For each functional group that you measured along the transect, we can get a measure of its abundance
by calculating the fraction of the transect that the functional group intersected. We will walk you
through how to do this below.
With the same data, you can also calculate some measures of biodiversity at each site. Diversity can be
described and compared in multiple ways. One method is to simply total up the number of species (or
functional groups) that you recorded in an area, and we call this measure of diversity species richness.
Richness doesn't tell us anything about the representation of the different species, however, and that
information may be of interest. For example, a habitat may be dominated by one species, with all other
species being rare; this is a pattern we call 'uneven'. In contrast, another site may have the same
species richness (number of species), but they are all present in equal quantities, which we call 'even'.
Therefore, we would like to have a measure of diversity that includes both richness and evenness.
There are several calculations for this, but one of the most common is the Shannon-Wiener Diversity
Index (H'), which is calculated like this:
H' = -Σ [p;*ln(p;)]
Unit 14 Lab Part 1 - Transect Measure
4 of 5
Where Pi
is the proportion of each species i in our dataset, and Σ means 'sum' in mathematical notation.
So H' is the sum of the proportion of each species, each weighted (multiplied) by the natural log (ln) of
that value. Take some time to understand this equation. It might look strange to you at first, but it
will make sense with some effort.
Why multiply by the natural log? Imagine if one species is dominant and its proportion is nearly '1';
because In(1) is zero, then this measure of diversity will be nearly zero. If there are several evenly
abundant species, their proportions each are smaller, but the value of the -In of each value goes up
(though more and more slowly as the numbers get smaller). Therefore, as the richness and evenness go
up, so does the value of H', making it a useful way to compare diversity among sites.
Expert Solution
This question has been solved!
Explore an expertly crafted, step-by-step solution for a thorough understanding of key concepts.

Step by step
Solved in 3 steps

Knowledge Booster


Learn more about
Need a deep-dive on the concept behind this application? Look no further. Learn more about this topic, biology and related others by exploring similar questions and additional content below.Recommended textbooks for you