Imagine you work for a large company that sells a variety of cleaning supplies deigned to prevent the spread of viruses. You decide to investigate what the best method for preventing the spread of viruses is, if only one method is use You design experiments with the following groups: hand sanitizer only, hand washing without soap, hand washing with soap, along with a control group. Each group has 181 observations during testing, beginning with a certain amount of the viruses present before treatment is applied. The amount of germs is being measured. You find a sum of squares between treatments of 578.59, along with a sum of squares error of 5022.05. Using this information, what is the F-statistic of your analysis?
Imagine you work for a large company that sells a variety of cleaning supplies deigned to prevent the spread of viruses. You decide to investigate what the best method for preventing the spread of viruses is, if only one method is use You design experiments with the following groups: hand sanitizer only, hand washing without soap, hand washing with soap, along with a control group. Each group has 181 observations during testing, beginning with a certain amount of the viruses present before treatment is applied. The amount of germs is being measured. You find a sum of squares between treatments of 578.59, along with a sum of squares error of 5022.05. Using this information, what is the F-statistic of your analysis?

Linear Algebra: A Modern Introduction
4th Edition
ISBN:9781285463247
Author:David Poole
Publisher:David Poole
Chapter7: Distance And Approximation
Section7.3: Least Squares Approximation
Problem 31EQ

Related questions
Question
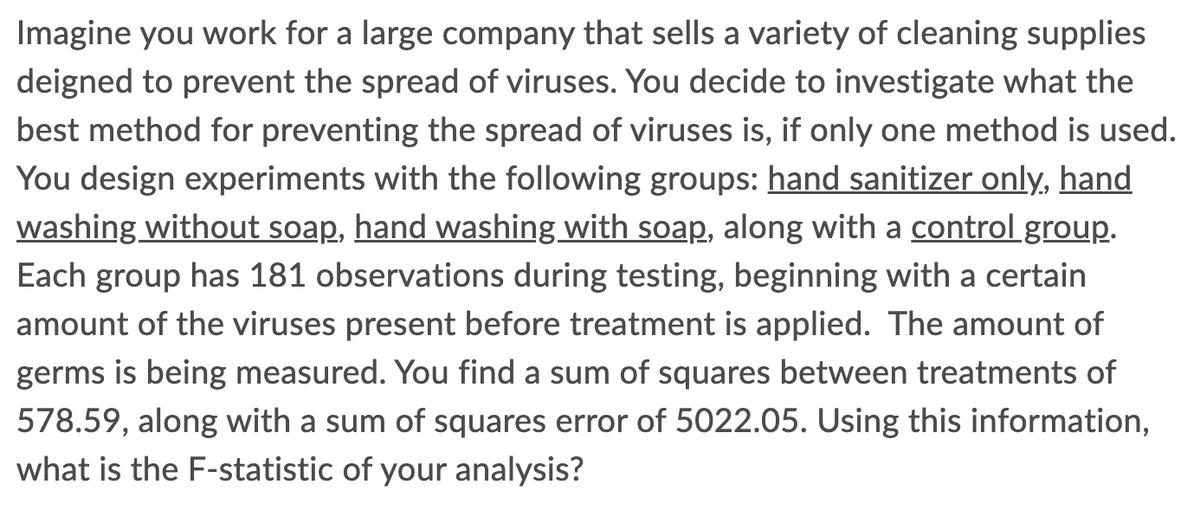
Transcribed Image Text:Imagine you work for a large company that sells a variety of cleaning supplies
deigned to prevent the spread of viruses. You decide to investigate what the
best method for preventing the spread of viruses is, if only one method is used.
You design experiments with the following groups: hand sanitizer only, hand
washing without soap, hand washing with soap, along with a control group.
Each group has 181 observations during testing, beginning with a certain
amount of the viruses present before treatment is applied. The amount of
germs is being measured. You find a sum of squares between treatments of
578.59, along with a sum of squares error of 5022.05. Using this information,
what is the F-statistic of your analysis?
Expert Solution
This question has been solved!
Explore an expertly crafted, step-by-step solution for a thorough understanding of key concepts.

Step by step
Solved in 2 steps with 1 images

Recommended textbooks for you
Linear Algebra: A Modern Introduction
Algebra
ISBN:
9781285463247
Author:
David Poole
Publisher:
Cengage Learning
Linear Algebra: A Modern Introduction
Algebra
ISBN:
9781285463247
Author:
David Poole
Publisher:
Cengage Learning