her information will be used in a work measurement analysis. The total ma W. 95 97 124 128 142 98 108 120 112 111 150 117 122 24 97 138 133 136 120 112 146 97 116 92 122 125 35 114 109 100 111 131 113 132 116 98 112 138 100 e the mean, the median, and the mode of the data Comment on the resul range, the variance, the standard deviation, and the mean deviation, coet and coefficient of skewness of the data
her information will be used in a work measurement analysis. The total ma W. 95 97 124 128 142 98 108 120 112 111 150 117 122 24 97 138 133 136 120 112 146 97 116 92 122 125 35 114 109 100 111 131 113 132 116 98 112 138 100 e the mean, the median, and the mode of the data Comment on the resul range, the variance, the standard deviation, and the mean deviation, coet and coefficient of skewness of the data

Algebra & Trigonometry with Analytic Geometry
13th Edition
ISBN:9781133382119
Author:Swokowski
Publisher:Swokowski
Chapter10: Sequences, Series, And Probability
Section10.2: Arithmetic Sequences
Problem 67E

Related questions
Question
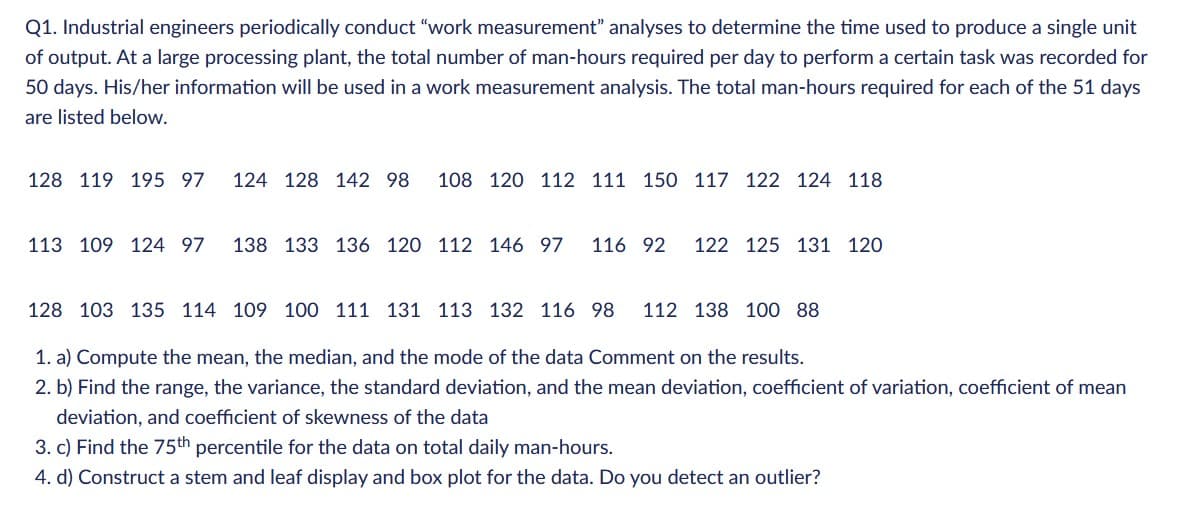
Transcribed Image Text:Q1. Industrial engineers periodically conduct "work measurement" analyses to determine the time used to produce a single unit
of output. At a large processing plant, the total number of man-hours required per day to perform a certain task was recorded for
50 days. His/her information will be used in a work measurement analysis. The total man-hours required for each of the 51 days
are listed below.
128 119 195 97 124 128 142 98 108 120 112 111 150 117 122 124 118.
113 109 124 97 138 133 136 120 112 146 97 116 92 122 125 131 120.
128 103 135 114 109 100 111 131 113 132 116 98 112 138 100 88
1. a) Compute the mean, the median, and the mode of the data Comment on the results.
2. b) Find the range, the variance, the standard deviation, and the mean deviation, coefficient of variation, coefficient of mean
deviation, and coefficient of skewness of the data
3. c) Find the 75th percentile for the data on total daily man-hours.
4. d) Construct a stem and leaf display and box plot for the data. Do you detect an outlier?
Expert Solution
This question has been solved!
Explore an expertly crafted, step-by-step solution for a thorough understanding of key concepts.

Step by step
Solved in 3 steps

Recommended textbooks for you
Algebra & Trigonometry with Analytic Geometry
Algebra
ISBN:
9781133382119
Author:
Swokowski
Publisher:
Cengage
Algebra & Trigonometry with Analytic Geometry
Algebra
ISBN:
9781133382119
Author:
Swokowski
Publisher:
Cengage