In 1956, M. King Hubbert proposed a model to analyze crude oil production.t His model, with updated data, gives world crude oil production as 254.43e -0.042r P=. (1 + 2.12e-0.0425,2" Here Pis measured in billions of barrels per year, and t is time, in years, since 2000. (a) Make a graph of world crude oil production for 2000 through 2040. P 35 35 30 30 25 25 20 20 15 19 10 10 10 20 30 40 10 20 30 40 35 30 35 30 25 25 20 20 15 15 10 10 5 10 20 30 40 10 20 30 40 (b) In what year does this model predict a peak in world crude oil production? (Round your answer to the nearest whole number.) (c) What is the maximum crude oil production predicted by this model? (Round your answer to the nearest whole number.) billion barrels per year
In 1956, M. King Hubbert proposed a model to analyze crude oil production.t His model, with updated data, gives world crude oil production as 254.43e -0.042r P=. (1 + 2.12e-0.0425,2" Here Pis measured in billions of barrels per year, and t is time, in years, since 2000. (a) Make a graph of world crude oil production for 2000 through 2040. P 35 35 30 30 25 25 20 20 15 19 10 10 10 20 30 40 10 20 30 40 35 30 35 30 25 25 20 20 15 15 10 10 5 10 20 30 40 10 20 30 40 (b) In what year does this model predict a peak in world crude oil production? (Round your answer to the nearest whole number.) (c) What is the maximum crude oil production predicted by this model? (Round your answer to the nearest whole number.) billion barrels per year

Functions and Change: A Modeling Approach to College Algebra (MindTap Course List)
6th Edition
ISBN:9781337111348
Author:Bruce Crauder, Benny Evans, Alan Noell
Publisher:Bruce Crauder, Benny Evans, Alan Noell
Chapter2: Graphical And Tabular Analysis
Section2.1: Tables And Trends
Problem 1TU: If a coffee filter is dropped, its velocity after t seconds is given by v(t)=4(10.0003t) feet per...

Related questions

Concept explainers
Contingency Table
A contingency table can be defined as the visual representation of the relationship between two or more categorical variables that can be evaluated and registered. It is a categorical version of the scatterplot, which is used to investigate the linear relationship between two variables. A contingency table is indeed a type of frequency distribution table that displays two variables at the same time.
Binomial Distribution
Binomial is an algebraic expression of the sum or the difference of two terms. Before knowing about binomial distribution, we must know about the binomial theorem.
Topic Video
Question
1
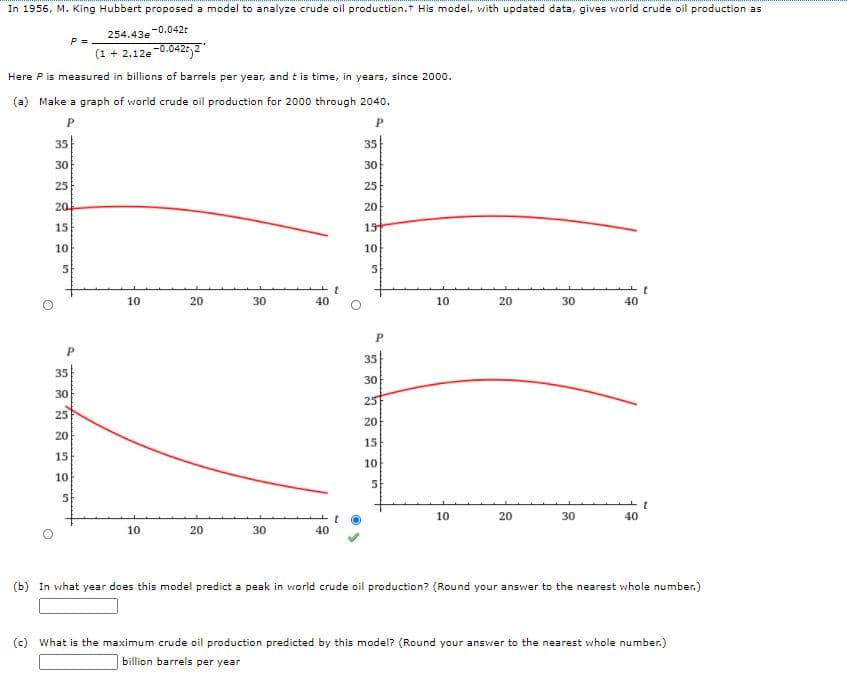
Transcribed Image Text:In 1956, M. King Hubbert proposed a model to analyze crude oil production.t His model, vwith updated data, gives world crude oil production as
254.43e -0.042r
P =
(1 + 2.12e-0.0427,2"
Here Pis measured in billions of barrels per year, and t is time, in years, since 2000.
(a) Make a graph of world crude oil production for 2000 through 2040.
35
35
30
30
25
25
20
20
15
19
10
10
5.
10
20
30
40
10
20
30
40
35
35
30
30
25
25
20
20
15
15
10
10
5
10
20
30
40
10
20
30
40
(b) In what year does this model predict a peak in world crude oil production? (Round your answer to the nearest whole number.)
(c) What is the maximum crude oil production predicted by this model? (Round your answer to the nearest whole number.)
billion barrels per year
Expert Solution
This question has been solved!
Explore an expertly crafted, step-by-step solution for a thorough understanding of key concepts.

This is a popular solution!

Trending now
This is a popular solution!

Step by step
Solved in 2 steps

Knowledge Booster


Learn more about
Need a deep-dive on the concept behind this application? Look no further. Learn more about this topic, advanced-math and related others by exploring similar questions and additional content below.Recommended textbooks for you
Functions and Change: A Modeling Approach to Coll…
Algebra
ISBN:
9781337111348
Author:
Bruce Crauder, Benny Evans, Alan Noell
Publisher:
Cengage Learning

Algebra & Trigonometry with Analytic Geometry
Algebra
ISBN:
9781133382119
Author:
Swokowski
Publisher:
Cengage

College Algebra (MindTap Course List)
Algebra
ISBN:
9781305652231
Author:
R. David Gustafson, Jeff Hughes
Publisher:
Cengage Learning
Functions and Change: A Modeling Approach to Coll…
Algebra
ISBN:
9781337111348
Author:
Bruce Crauder, Benny Evans, Alan Noell
Publisher:
Cengage Learning
Algebra & Trigonometry with Analytic Geometry
Algebra
ISBN:
9781133382119
Author:
Swokowski
Publisher:
Cengage
College Algebra (MindTap Course List)
Algebra
ISBN:
9781305652231
Author:
R. David Gustafson, Jeff Hughes
Publisher:
Cengage Learning


Glencoe Algebra 1, Student Edition, 9780079039897…
Algebra
ISBN:
9780079039897
Author:
Carter
Publisher:
McGraw Hill

Trigonometry (MindTap Course List)
Trigonometry
ISBN:
9781337278461
Author:
Ron Larson
Publisher:
Cengage Learning