In 2010 a particular factory produced computer hard drives at a rate of f(t) = 4.4e0.0175t thousand drives per month where t is the time in months after the start of that year. In 2011 the production rate was g(t) = 5.4e0.0164t thousand drives per month t months after the start of that year. Compute the area between the graphs of these functions for 0 sts 12. (Round your answer to three decimal places.) thousand Interpret your result in this context. O This area indicates the total number of hard drives produced in 2010 and 2011. O This area indicates the total number of hard drives produced in 2010. O This area indicates that fewer hard drives were produced in 2011 than in 2010. O This area indicates the total number of hard drives produced in 2011. O This area indicates that more hard drives were produced in 2011 than in 2010.
In 2010 a particular factory produced computer hard drives at a rate of f(t) = 4.4e0.0175t thousand drives per month where t is the time in months after the start of that year. In 2011 the production rate was g(t) = 5.4e0.0164t thousand drives per month t months after the start of that year. Compute the area between the graphs of these functions for 0 sts 12. (Round your answer to three decimal places.) thousand Interpret your result in this context. O This area indicates the total number of hard drives produced in 2010 and 2011. O This area indicates the total number of hard drives produced in 2010. O This area indicates that fewer hard drives were produced in 2011 than in 2010. O This area indicates the total number of hard drives produced in 2011. O This area indicates that more hard drives were produced in 2011 than in 2010.

Advanced Engineering Mathematics
10th Edition
ISBN:9780470458365
Author:Erwin Kreyszig
Publisher:Erwin Kreyszig
Chapter2: Second-order Linear Odes
Section: Chapter Questions
Problem 1RQ

Related questions

Concept explainers
Riemann Sum
Riemann Sums is a special type of approximation of the area under a curve by dividing it into multiple simple shapes like rectangles or trapezoids and is used in integrals when finite sums are involved. Figuring out the area of a curve is complex hence this method makes it simple. Usually, we take the help of different integration methods for this purpose. This is one of the major parts of integral calculus.
Riemann Integral
Bernhard Riemann's integral was the first systematic description of the integral of a function on an interval in the branch of mathematics known as real analysis.
Question
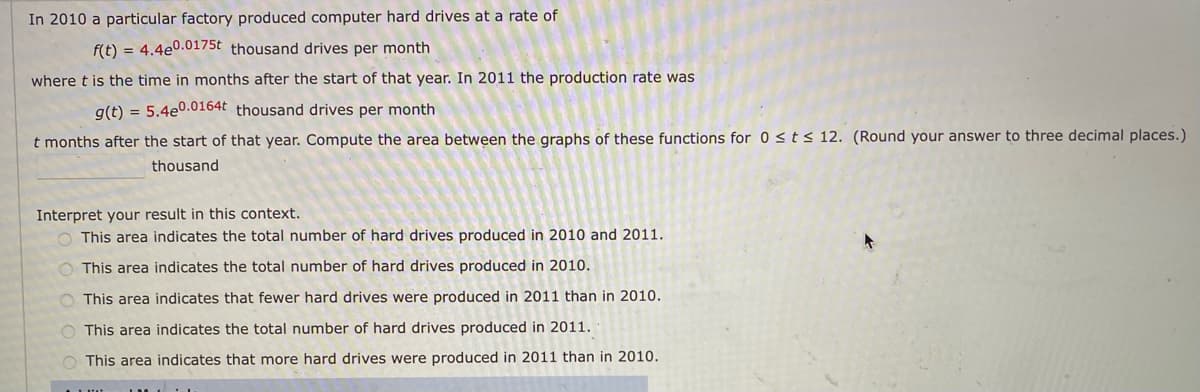
Transcribed Image Text:In 2010 a particular factory produced computer hard drives at a rate of
f(t) = 4.4e0.0175t thousand drives per month
where t is the time in months after the start of that year. In 2011 the production rate was
g(t) = 5.4e0.0164t thousand drives per month
t months after the start of that year. Compute the area between the graphs of these functions for 0 <ts 12. (Round your answer to three decimal places.)
thousand
Interpret your result in this context.
O This area indicates the total number of hard drives produced in 2010 and 2011.
O This area indicates the total number of hard drives produced in 2010.
O This area indicates that fewer hard drives were produced in 2011 than in 2010.
O This area indicates the total number of hard drives produced in 2011.
O This area indicates that more hard drives were produced in 2011 than in 2010.
Expert Solution
This question has been solved!
Explore an expertly crafted, step-by-step solution for a thorough understanding of key concepts.

Step by step
Solved in 3 steps

Knowledge Booster


Learn more about
Need a deep-dive on the concept behind this application? Look no further. Learn more about this topic, advanced-math and related others by exploring similar questions and additional content below.Recommended textbooks for you
Advanced Engineering Mathematics
Advanced Math
ISBN:
9780470458365
Author:
Erwin Kreyszig
Publisher:
Wiley, John & Sons, Incorporated

Numerical Methods for Engineers
Advanced Math
ISBN:
9780073397924
Author:
Steven C. Chapra Dr., Raymond P. Canale
Publisher:
McGraw-Hill Education

Introductory Mathematics for Engineering Applicat…
Advanced Math
ISBN:
9781118141809
Author:
Nathan Klingbeil
Publisher:
WILEY
Advanced Engineering Mathematics
Advanced Math
ISBN:
9780470458365
Author:
Erwin Kreyszig
Publisher:
Wiley, John & Sons, Incorporated
Numerical Methods for Engineers
Advanced Math
ISBN:
9780073397924
Author:
Steven C. Chapra Dr., Raymond P. Canale
Publisher:
McGraw-Hill Education
Introductory Mathematics for Engineering Applicat…
Advanced Math
ISBN:
9781118141809
Author:
Nathan Klingbeil
Publisher:
WILEY

Mathematics For Machine Technology
Advanced Math
ISBN:
9781337798310
Author:
Peterson, John.
Publisher:
Cengage Learning,

