In 2011, a U.S. Census report determined that 71% of college students work. A researcher thinks this percentage has changed since then. A survey of 110 college students reported that 91 of them work. Is there evidence to support the reasearcher's claim at the 1% significance level? A normal probability plot indicates that the population is normally distributed. a) Determine the null and alternative hypotheses. Ho: P = Ha: p Select an answer ✓ b) Determine the test statistic. Round to two decimals. 2 = c) Find the p-value. Round to 4 decimals. P-value = d) Make a decision. (Put in the correct symbol and value)
In 2011, a U.S. Census report determined that 71% of college students work. A researcher thinks this percentage has changed since then. A survey of 110 college students reported that 91 of them work. Is there evidence to support the reasearcher's claim at the 1% significance level? A normal probability plot indicates that the population is normally distributed. a) Determine the null and alternative hypotheses. Ho: P = Ha: p Select an answer ✓ b) Determine the test statistic. Round to two decimals. 2 = c) Find the p-value. Round to 4 decimals. P-value = d) Make a decision. (Put in the correct symbol and value)

MATLAB: An Introduction with Applications
6th Edition
ISBN:9781119256830
Author:Amos Gilat
Publisher:Amos Gilat
Chapter1: Starting With Matlab
Section: Chapter Questions
Problem 1P

Related questions
Question
I need this ASAP, please.
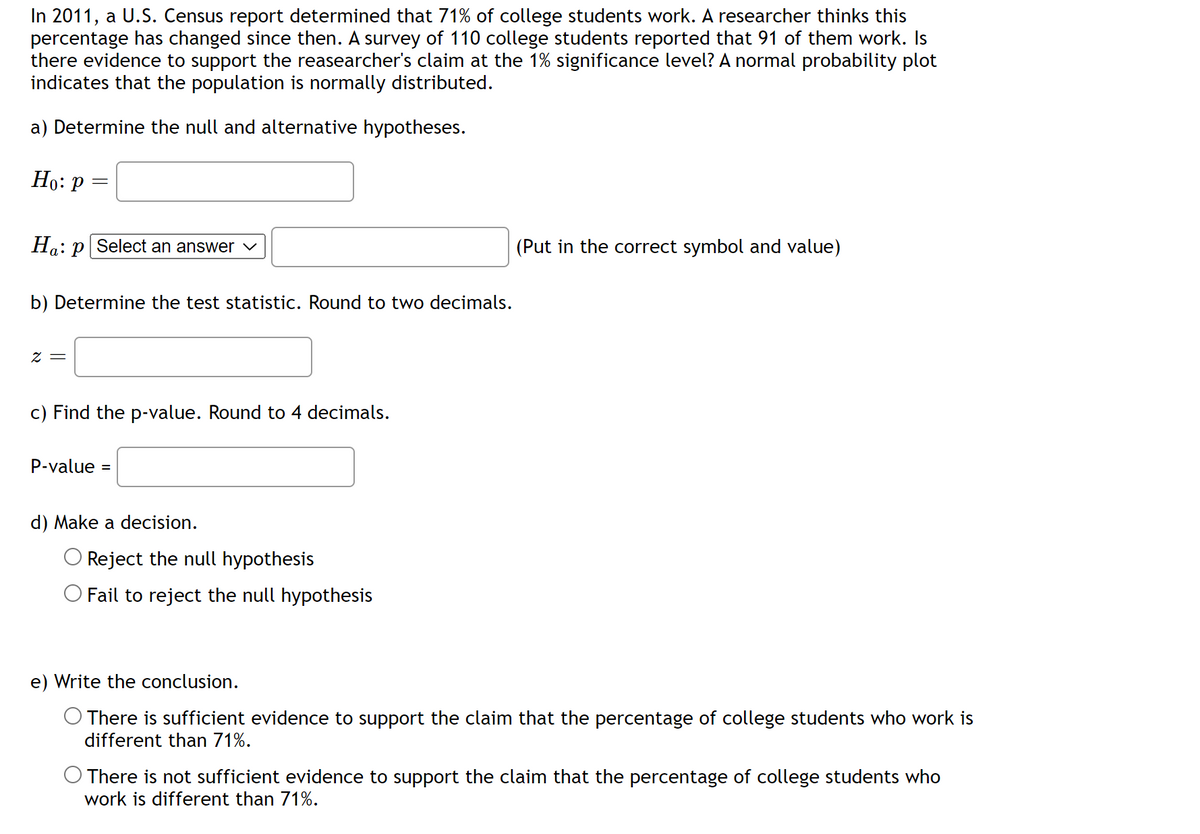
Transcribed Image Text:In 2011, a U.S. Census report determined that 71% of college students work. A researcher thinks this
percentage has changed since then. A survey of 110 college students reported that 91 of them work. Is
there evidence to support the reasearcher's claim at the 1% significance level? A normal probability plot
indicates that the population is normally distributed.
a) Determine the null and alternative hypotheses.
Ho: P
=
Ha:p Select an answer
b) Determine the test statistic. Round to two decimals.
z =
c) Find the p-value. Round to 4 decimals.
P-value =
d) Make a decision.
Reject the null hypothesis
O Fail to reject the null hypothesis
(Put in the correct symbol and value)
e) Write the conclusion.
O There is sufficient evidence to support the claim that the percentage of college students who work is
different than 71%.
There is not sufficient evidence to support the claim that the percentage of college students who
work is different than 71%.
Expert Solution
This question has been solved!
Explore an expertly crafted, step-by-step solution for a thorough understanding of key concepts.

This is a popular solution!

Trending now
This is a popular solution!

Step by step
Solved in 2 steps with 1 images

Recommended textbooks for you
MATLAB: An Introduction with Applications
Statistics
ISBN:
9781119256830
Author:
Amos Gilat
Publisher:
John Wiley & Sons Inc

Probability and Statistics for Engineering and th…
Statistics
ISBN:
9781305251809
Author:
Jay L. Devore
Publisher:
Cengage Learning

Statistics for The Behavioral Sciences (MindTap C…
Statistics
ISBN:
9781305504912
Author:
Frederick J Gravetter, Larry B. Wallnau
Publisher:
Cengage Learning
MATLAB: An Introduction with Applications
Statistics
ISBN:
9781119256830
Author:
Amos Gilat
Publisher:
John Wiley & Sons Inc
Probability and Statistics for Engineering and th…
Statistics
ISBN:
9781305251809
Author:
Jay L. Devore
Publisher:
Cengage Learning
Statistics for The Behavioral Sciences (MindTap C…
Statistics
ISBN:
9781305504912
Author:
Frederick J Gravetter, Larry B. Wallnau
Publisher:
Cengage Learning

Elementary Statistics: Picturing the World (7th E…
Statistics
ISBN:
9780134683416
Author:
Ron Larson, Betsy Farber
Publisher:
PEARSON

The Basic Practice of Statistics
Statistics
ISBN:
9781319042578
Author:
David S. Moore, William I. Notz, Michael A. Fligner
Publisher:
W. H. Freeman

Introduction to the Practice of Statistics
Statistics
ISBN:
9781319013387
Author:
David S. Moore, George P. McCabe, Bruce A. Craig
Publisher:
W. H. Freeman