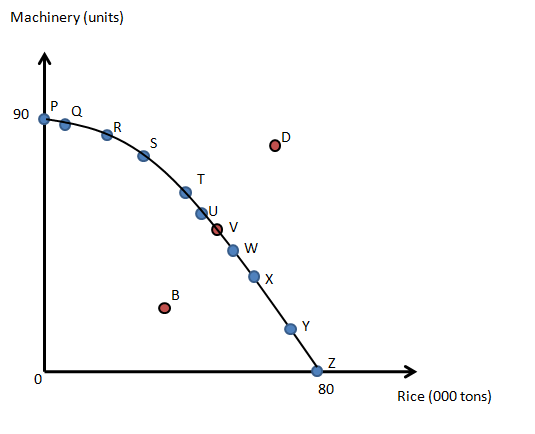
In 2017, Nepal’s production of rice and machinery was published by the Nepal Bureau of Statistics (NBS) as indicated by the table below: Production in Nepal Position P Q R S T U V W X Y Z Rice (1000 tons) 0 10 26 37 45 50 55 59 66 77 80 Machinery (units) 90 89 85 80 75 70 65 60 50 30 0 Based on the table above, a production possibility frontier (PPF) for Nepal can be plotted as below: Use the NBS production table and production possibility frontier to answer the following questions: Name positions B, V and D. Also, as indicated in the table, supposing Nepal is operating at level T, what is the opportunity cost of producing 10,000 more tons of rice?


In 2017, Nepal’s production of rice and machinery was published by the Nepal Bureau of Statistics (NBS) as indicated by the table below:
Production in Nepal
|
Position
|
P |
Q |
R |
S |
T |
U |
V |
W |
X |
Y |
Z |
|
Rice (1000 tons) |
0 |
10 |
26 |
37 |
45 |
50 |
55 |
59 |
66 |
77 |
80 |
|
Machinery (units) |
90 |
89 |
85 |
80 |
75 |
70 |
65 |
60 |
50 |
30 |
0 |
|
|
|
|
|
|
|
|
|
|
|
|
|
Based on the table above, a
Use the NBS production table and production possibility frontier to answer the following questions:
Name positions B, V and D. Also, as indicated in the table, supposing Nepal is operating at level T, what is the
The PPC can be illustrated as:

Step by step
Solved in 2 steps with 1 images


