In a case-control study researchers investigated whether there was an association between living near a high-hazard dump site versus a low-hazard dump site and risk of having a low birth weight child. The study found that in a group of women living near a high-hazard dump site while pregnant there were 181 low birth weight children and 4268 normal birth weight children. Corresponding numbers for women living near a low-hazard dump site were 126 and 4236, respectively. a. Formulate the null and alternative hypotheses. b. Estimate the odds ratio and 95% confidence interval. Interpret the result and say what the interval tells us about statistical significance. 20. 19
In a case-control study researchers investigated whether there was an association between living near a high-hazard dump site versus a low-hazard dump site and risk of having a low birth weight child. The study found that in a group of women living near a high-hazard dump site while pregnant there were 181 low birth weight children and 4268 normal birth weight children. Corresponding numbers for women living near a low-hazard dump site were 126 and 4236, respectively. a. Formulate the null and alternative hypotheses. b. Estimate the odds ratio and 95% confidence interval. Interpret the result and say what the interval tells us about statistical significance. 20. 19

Big Ideas Math A Bridge To Success Algebra 1: Student Edition 2015
1st Edition
ISBN:9781680331141
Author:HOUGHTON MIFFLIN HARCOURT
Publisher:HOUGHTON MIFFLIN HARCOURT
Chapter4: Writing Linear Equations
Section: Chapter Questions
Problem 14CR

Related questions
Question
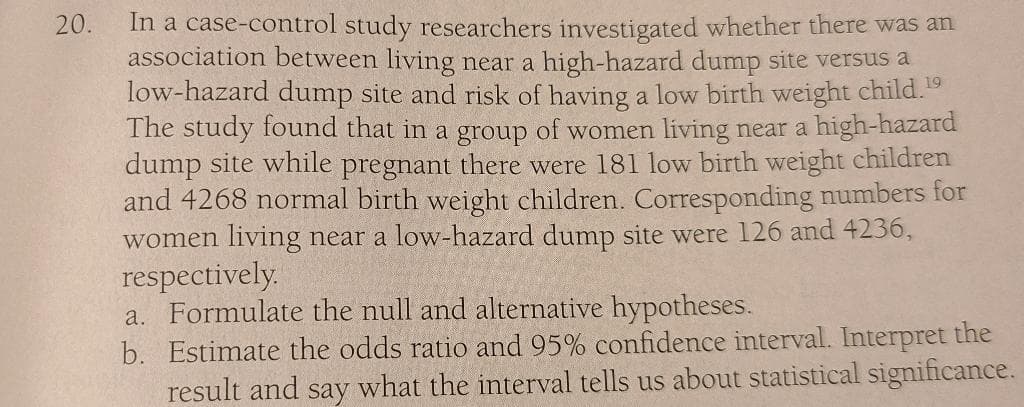
Transcribed Image Text:In a case-control study researchers investigated whether there was an
association between living near a high-hazard dump site versus a
low-hazard dump site and risk of having a low birth weight child.
The study found that in a group of women living near a high-hazard
dump site while pregnant there were 181 low birth weight children
and 4268 normal birth weight children. Corresponding numbers for
women living near a low-hazard dump site were 126 and 4236,
respectively.
a. Formulate the null and alternative hypotheses.
b. Estimate the odds ratio and 95% confidence interval. Interpret the
result and say what the interval tells us about statistical significance.
20.
Expert Solution
This question has been solved!
Explore an expertly crafted, step-by-step solution for a thorough understanding of key concepts.

This is a popular solution!

Trending now
This is a popular solution!

Step by step
Solved in 4 steps

Recommended textbooks for you
Big Ideas Math A Bridge To Success Algebra 1: Stu…
Algebra
ISBN:
9781680331141
Author:
HOUGHTON MIFFLIN HARCOURT
Publisher:
Houghton Mifflin Harcourt
Big Ideas Math A Bridge To Success Algebra 1: Stu…
Algebra
ISBN:
9781680331141
Author:
HOUGHTON MIFFLIN HARCOURT
Publisher:
Houghton Mifflin Harcourt