A study was conducted to assess the impact of nutrient enrichment on zooplankton densities in A & B Islands. An ecologist sampled populations of zooplankton in these two locations and observed the nutrient enrichment level was higher in A island when compared with the level in B island. It is predicted the zooplankton densities in A island will be greater than those found in B island.
A study was conducted to assess the impact of nutrient enrichment on zooplankton densities in A & B Islands. An ecologist sampled populations of zooplankton in these two locations and observed the nutrient enrichment level was higher in A island when compared with the level in B island. It is predicted the zooplankton densities in A island will be greater than those found in B island.

Glencoe Algebra 1, Student Edition, 9780079039897, 0079039898, 2018
18th Edition
ISBN:9780079039897
Author:Carter
Publisher:Carter
Chapter4: Equations Of Linear Functions
Section: Chapter Questions
Problem 8SGR

Related questions
Question
100%
A study was conducted to assess the impact of nutrient enrichment on zooplankton densities in A & B Islands. An ecologist sampled populations of zooplankton in these two locations and observed the nutrient enrichment level was higher in A island when compared with the level in B island. It is predicted the zooplankton densities in A island will be greater than those found in B island.
![Examine the SPSS outputs below. Assume that data from example (I) is normally distríbuted, has equal sample size and with homogeneous
variance, and (II) has normal differences (a=0.05). Based on the scenarios given, discuss and state the:
[Periksa output SPSS di bawah. Andaikan baihawa data daripada contoh (i) bertaburan normal, mempunyai saiz sampel yang sama dan dengan varianS
homogen, dan (H) mempunyai perbezaan normal (a=0.05). Berdasarkan senario yang diberikan, bincangkan dan nyatakan:)
Number of samples (n)
[Bilangan sampel (n)}
Type of test used and direction of test, and why?
Jenis ujian yang digunakan dan arah ujian, dan mengapa?)
Hypothesis (null and alternative)
[Hipotesis (nui dan alternatif)}
p value
{Nilai p}
Reject / fail to reject null hypothesis, and why?
[Tolak / gagal untuk menolak hipotesis nol, dan mengapa?]
Conclusion
[Kesimpulan)](/v2/_next/image?url=https%3A%2F%2Fcontent.bartleby.com%2Fqna-images%2Fquestion%2F4b3e384e-5f91-4be8-aca6-520832fab52e%2Fbed32776-3363-4ec0-8b3e-c8654595a13e%2F10glpgq_processed.jpeg&w=3840&q=75)
Transcribed Image Text:Examine the SPSS outputs below. Assume that data from example (I) is normally distríbuted, has equal sample size and with homogeneous
variance, and (II) has normal differences (a=0.05). Based on the scenarios given, discuss and state the:
[Periksa output SPSS di bawah. Andaikan baihawa data daripada contoh (i) bertaburan normal, mempunyai saiz sampel yang sama dan dengan varianS
homogen, dan (H) mempunyai perbezaan normal (a=0.05). Berdasarkan senario yang diberikan, bincangkan dan nyatakan:)
Number of samples (n)
[Bilangan sampel (n)}
Type of test used and direction of test, and why?
Jenis ujian yang digunakan dan arah ujian, dan mengapa?)
Hypothesis (null and alternative)
[Hipotesis (nui dan alternatif)}
p value
{Nilai p}
Reject / fail to reject null hypothesis, and why?
[Tolak / gagal untuk menolak hipotesis nol, dan mengapa?]
Conclusion
[Kesimpulan)
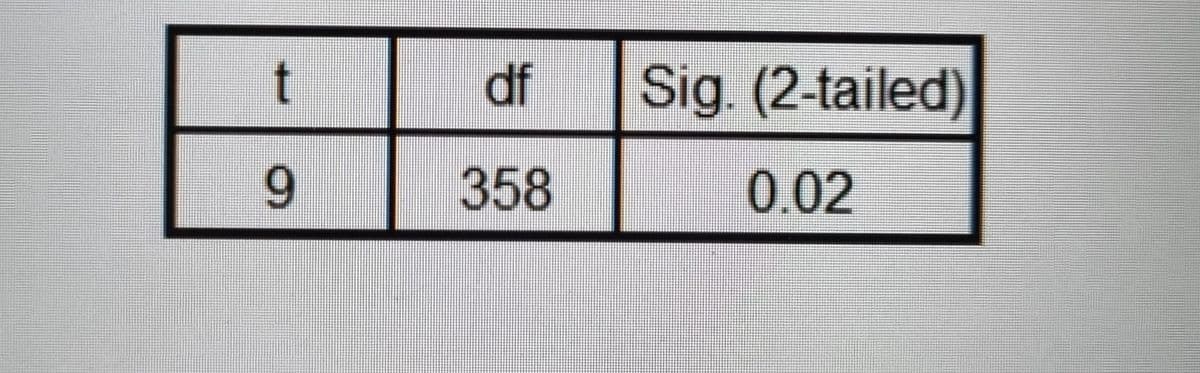
Transcribed Image Text:t
df Sig. (2-tailed)
6.
358
0.02
Expert Solution
This question has been solved!
Explore an expertly crafted, step-by-step solution for a thorough understanding of key concepts.

Step by step
Solved in 2 steps with 4 images

Recommended textbooks for you
Glencoe Algebra 1, Student Edition, 9780079039897…
Algebra
ISBN:
9780079039897
Author:
Carter
Publisher:
McGraw Hill
Glencoe Algebra 1, Student Edition, 9780079039897…
Algebra
ISBN:
9780079039897
Author:
Carter
Publisher:
McGraw Hill