In a certain jurisdiction, all students in Grade Three are required to take a standardized test to evaluate their math comprehension skills. The file contains these data resulting from a random sample of n=30 schools within this jurisdiction. From these data you wish to estimate the model Yi=β0+β1Xi+ei where Xi is the percentage of Grade Three students in School i who live below the poverty line and Yi is the average mathematics comprehension score for all Grade Three students in the same school, School i. The observed data for the X variable is labled perbelowpoverty and the observed data for the Y variable is labeled mathscore in the file. Import (either hand type or load the file) data into R Studio, then answer the following questions based on the data. (a) Create a scatterplot of the data. What can you say about the nature of the relationship between the percentage of Grade Three students living below the poverty line in a certain school and the school's average Grade Three mathematics comprehension test score? From the plot, it appears that the relationship between the Grade Three mathematics comprehension test score and the percentage of Grade Three students living below the poverty line I: A. Non-existent B. Positive C. Negative The best description for the strength of the relationship is that the relationship is: A. Strong B. Weak C. Neither weak nor strong (b) Compute the correlation coefficient. r = _______(enter as many decimals) (c) Fill in the blanks to estimate the model that estimates a school's average Grade Three mathematics comprehension score based on its linear relationship to the percentage of Grade Three students in the school who live below the poverty-line. Use as many decimals as printed.


In a certain jurisdiction, all students in Grade Three are required to take a standardized test to evaluate their math comprehension skills.
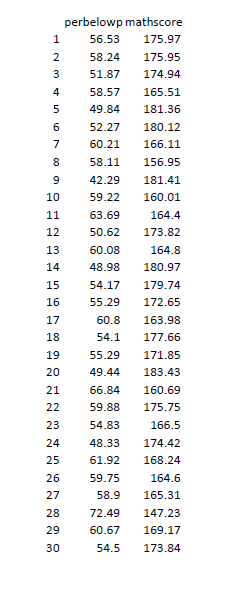
The file contains these data resulting from a random sample of n=30 schools within this jurisdiction. From these data you wish to estimate the model
where Xi is the percentage of Grade Three students in School i who live below the poverty line and Yi is the average mathematics comprehension score for all Grade Three students in the same school, School i. The observed data for the X variable is labled perbelowpoverty and the observed data for the Y variable is labeled mathscore in the file.
Import (either hand type or load the file) data into R Studio, then answer the following questions based on the data.
(a) Create a scatterplot of the data. What can you say about the nature of the relationship between the percentage of Grade Three students living below the poverty line in a certain school and the school's average Grade Three mathematics comprehension test score?
From the plot, it appears that the relationship between the Grade Three mathematics comprehension test score and the percentage of Grade Three students living below the poverty line I:
A. Non-existent
B. Positive
C. Negative
The best description for the strength of the relationship is that the relationship is:
A. Strong
B. Weak
C. Neither weak nor strong
(b) Compute the
(c) Fill in the blanks to estimate the model that estimates a school's average Grade Three mathematics comprehension score based on its linear relationship to the percentage of Grade Three students in the school who live below the poverty-line. Use as many decimals as printed.
Yi = ___________ +/- ___________ Xi

Step by step
Solved in 3 steps with 5 images
