In a certain state, the recent average critical reading standardized test score was 540. Assume that the standard deviation is 100 and that standardized test scores are Normally distributed. Complete parts (a) and (b) below. Include a Normal curve for each part. a. What percentage of standardized test takers scored 500 or less? Choose the Normal curve that represents the percentage of standardized test takers that scored 500 or less. OA. O B. В. Oc. OD. 2core 2score 2-4core 2score The percentage of standardized test takers who scored 500 or less is %. (Type an integer or decimal rounded to one decimal place as needed.) b. What percentage of standardized test takers scored less than 540? Choose the Normal curve that represents the percentage of standardized test takers that scored less than 540. OA. OB. Oc. OD. 2core 2score 2core 2-score
In a certain state, the recent average critical reading standardized test score was 540. Assume that the standard deviation is 100 and that standardized test scores are Normally distributed. Complete parts (a) and (b) below. Include a Normal curve for each part. a. What percentage of standardized test takers scored 500 or less? Choose the Normal curve that represents the percentage of standardized test takers that scored 500 or less. OA. O B. В. Oc. OD. 2core 2score 2-4core 2score The percentage of standardized test takers who scored 500 or less is %. (Type an integer or decimal rounded to one decimal place as needed.) b. What percentage of standardized test takers scored less than 540? Choose the Normal curve that represents the percentage of standardized test takers that scored less than 540. OA. OB. Oc. OD. 2core 2score 2core 2-score

Glencoe Algebra 1, Student Edition, 9780079039897, 0079039898, 2018
18th Edition
ISBN:9780079039897
Author:Carter
Publisher:Carter
Chapter10: Statistics
Section10.4: Distributions Of Data
Problem 22PFA

Related questions
Topic Video
Question
100%
help please.
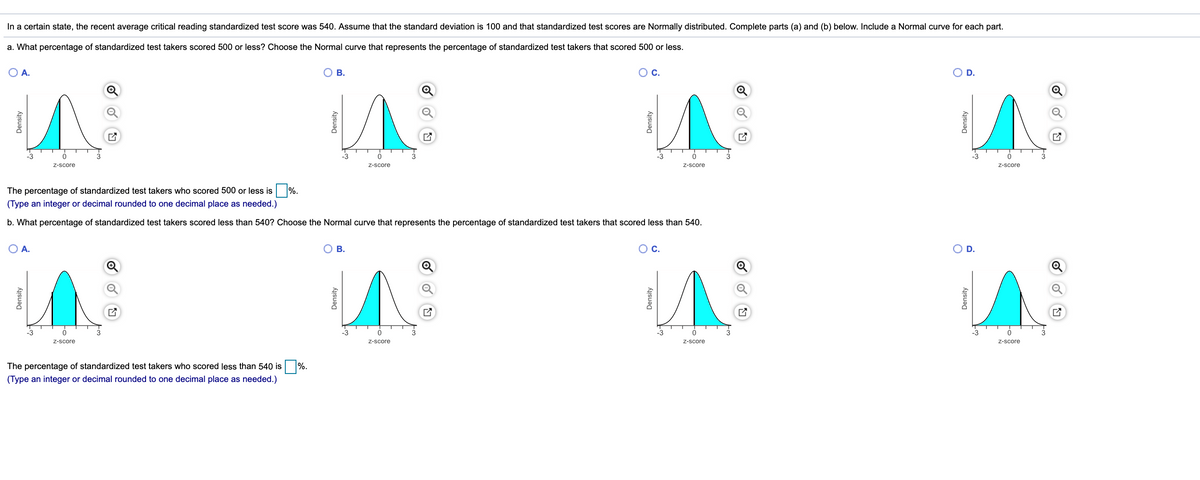
Transcribed Image Text:In a certain state, the recent average critical reading standardized test score was 540. Assume that the standard deviation is 100 and that standardized test scores are Normally distributed. Complete parts (a) and (b) below. Include a Normal curve for each part.
a. What percentage of standardized test takers scored 500 or less? Choose the Normal curve that represents the percentage of standardized test takers that scored 500 or less.
O A.
Ов.
Oc.
O D.
-3
-3
-3
-3
3
Z-score
Z-score
Z-score
Z-score
The percentage of standardized test takers who scored 500 or less is %.
(Type an integer or decimal rounded to one decimal place as needed.)
b. What percentage of standardized test takers scored less than 540? Choose the Normal curve that represents the percentage of standardized test takers that scored less than 540.
OA.
O B.
Ос.
O D.
-3
-3
-3
-3
3
Z-score
Z-score
Z-score
Z-score
The percentage of standardized test takers who scored less than 540 is %.
(Type an integer or decimal rounded to one decimal place as needed.)
Density
Density
Density
Density
Density
Density
Density
Density
Expert Solution
This question has been solved!
Explore an expertly crafted, step-by-step solution for a thorough understanding of key concepts.

This is a popular solution!

Trending now
This is a popular solution!

Step by step
Solved in 2 steps with 2 images

Knowledge Booster


Learn more about
Need a deep-dive on the concept behind this application? Look no further. Learn more about this topic, statistics and related others by exploring similar questions and additional content below.Recommended textbooks for you
Glencoe Algebra 1, Student Edition, 9780079039897…
Algebra
ISBN:
9780079039897
Author:
Carter
Publisher:
McGraw Hill
Glencoe Algebra 1, Student Edition, 9780079039897…
Algebra
ISBN:
9780079039897
Author:
Carter
Publisher:
McGraw Hill