A team of ten (10) construction workers who are working on a project are classified according to the skill levels, Classes A to D. The table below shows the number of workers in each of the four (4) classes and their respective hourly pay-rate. Pay-rate (Rands/hour) Number of workers Class A 80 60 1 3 Class B Class C Class D 55 2 50 4 Calculate the mean hourly pay-rate for the 10 workers. A. R24.50/hour B. R57/hour C. R57.50/hour D. R61.75/hour
A team of ten (10) construction workers who are working on a project are classified according to the skill levels, Classes A to D. The table below shows the number of workers in each of the four (4) classes and their respective hourly pay-rate. Pay-rate (Rands/hour) Number of workers Class A 80 60 1 3 Class B Class C Class D 55 2 50 4 Calculate the mean hourly pay-rate for the 10 workers. A. R24.50/hour B. R57/hour C. R57.50/hour D. R61.75/hour

Glencoe Algebra 1, Student Edition, 9780079039897, 0079039898, 2018
18th Edition
ISBN:9780079039897
Author:Carter
Publisher:Carter
Chapter10: Statistics
Section10.5: Comparing Sets Of Data
Problem 26PFA

Related questions
Question
100%
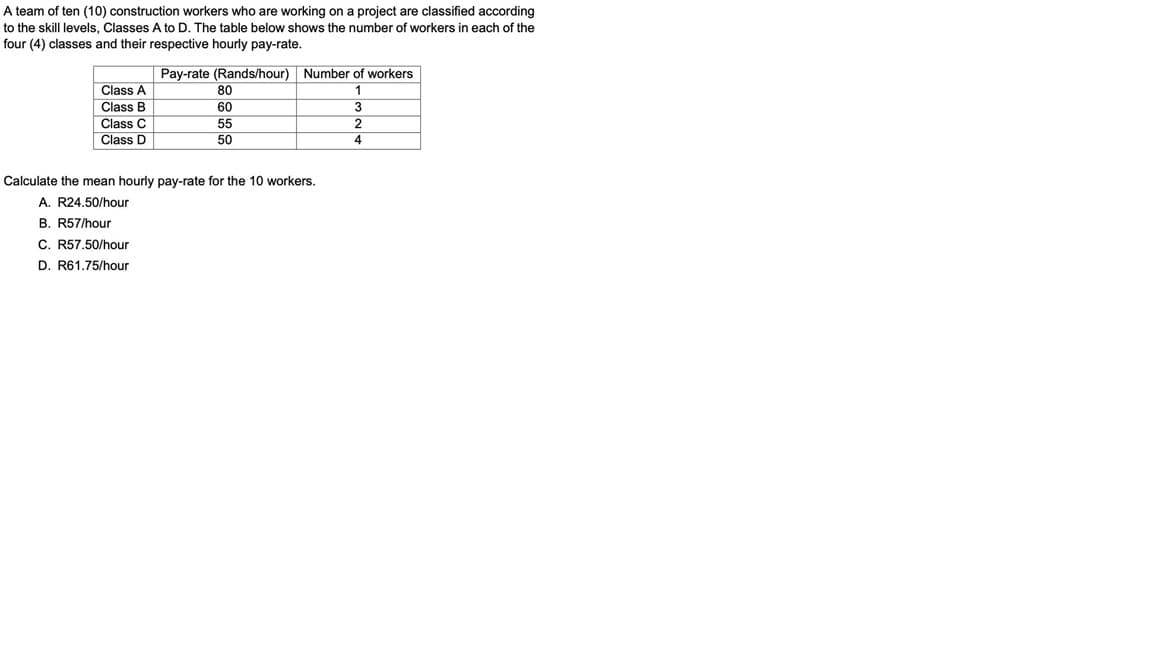
Transcribed Image Text:A team of ten (10) construction workers who are working on a project are classified according
to the skill levels, Classes A to D. The table below shows the number of workers in each of the
four (4) classes and their respective hourly pay-rate.
Pay-rate (Rands/hour) Number of workers
Class A
80
Class B
60
Class C
55
Class D
50
4.
Calculate the mean hourly pay-rate for the 10 workers.
A. R24.50/hour
B. R57/hour
C. R57.50/hour
D. R61.75/hour
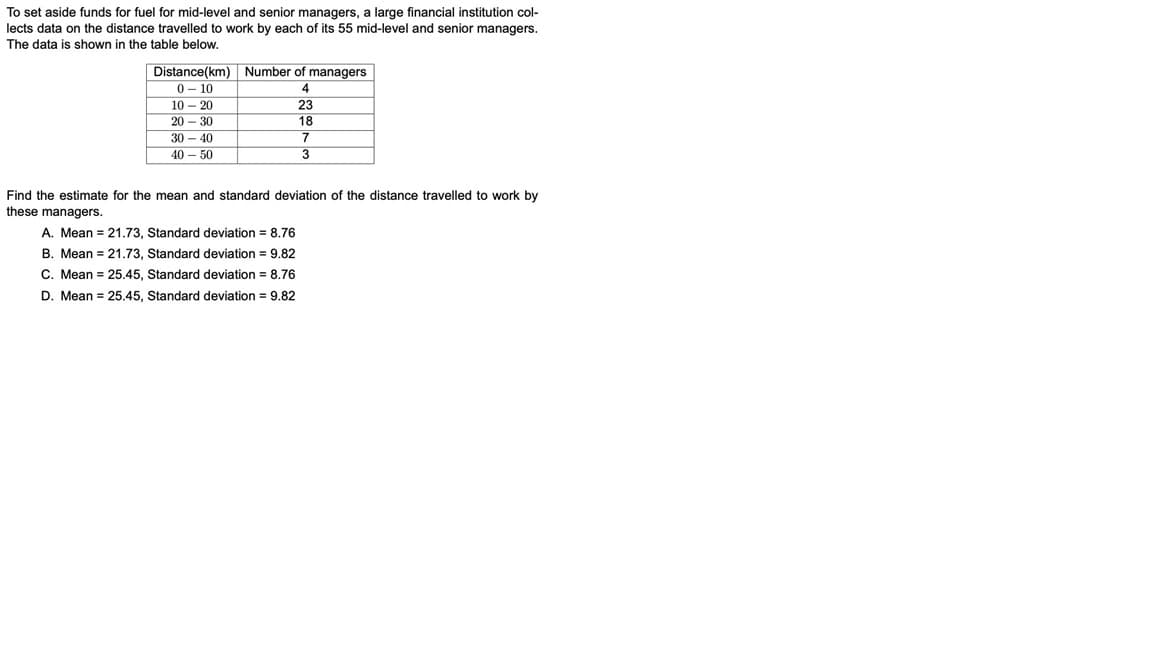
Transcribed Image Text:To set aside funds for fuel for mid-level and senior managers, a large financial institution col-
lects data on the distance travelled to work by each of its 55 mid-level and senior managers.
The data is shown in the table below.
Distance(km) Number of managers
0 - 10
10 – 20
23
20 - 30
18
30 - 40
40 – 50
Find the estimate for the mean and standard deviation of the distance travelled to work by
these managers.
A. Mean = 21.73, Standard deviation = 8.76
B. Mean = 21.73, Standard deviation = 9.82
C. Mean = 25.45, Standard deviation = 8.76
D. Mean = 25.45, Standard deviation = 9.82
Expert Solution
This question has been solved!
Explore an expertly crafted, step-by-step solution for a thorough understanding of key concepts.

Step by step
Solved in 2 steps with 2 images

Follow-up Questions
Read through expert solutions to related follow-up questions below.
Follow-up Question
from the data in question 5, find the estimate for the
Solution
Follow-up Question

Transcribed Image Text:To set aside funds for fuel for mid-level and senior managers, a large financial institution col-
lects data on the distance travelled to work by each of its 55 mid-level and senior managears.
The data is shown in the table below.
Number of managers
Distance(km)
0 - 10
10 - 20
20- 30
30- 40
40- 50
23
18
Find the estimate for the mcan and standard deviation of the distance travelled to work by
theso managors.
A. Mean = 21.73, Standard deviation = 8.76
Mean = 21.73, Standard deviation = 9.82
C. Mean = 25.45, Standard deviation = 8.76
D. Mean = 25.45, Standard deviation = 9.82
B.
For the data in Question 5, find the estimate for the mode.
А. 23
В. 20.28
C. 17.92
D. 15
Solution
Recommended textbooks for you
Glencoe Algebra 1, Student Edition, 9780079039897…
Algebra
ISBN:
9780079039897
Author:
Carter
Publisher:
McGraw Hill

College Algebra (MindTap Course List)
Algebra
ISBN:
9781305652231
Author:
R. David Gustafson, Jeff Hughes
Publisher:
Cengage Learning
Glencoe Algebra 1, Student Edition, 9780079039897…
Algebra
ISBN:
9780079039897
Author:
Carter
Publisher:
McGraw Hill
College Algebra (MindTap Course List)
Algebra
ISBN:
9781305652231
Author:
R. David Gustafson, Jeff Hughes
Publisher:
Cengage Learning